Articles / Fixesupdated for DaVinci Resolve 21.0.2 (July 2026)
DaVinci Resolve GPU Utilization 0% During Export, Explained
Quick answer
Task Manager's default GPU graph tracks the 3D engine, not the Video Encode engine DaVinci Resolve's hardware encoder actually uses, so 0% can be a false reading. Right-click the graph, choose Change graph to, and pick Video Encode to see the real number. If it's genuinely 0%, your Deliver page Encoder dropdown is set to Native, not your GPU.
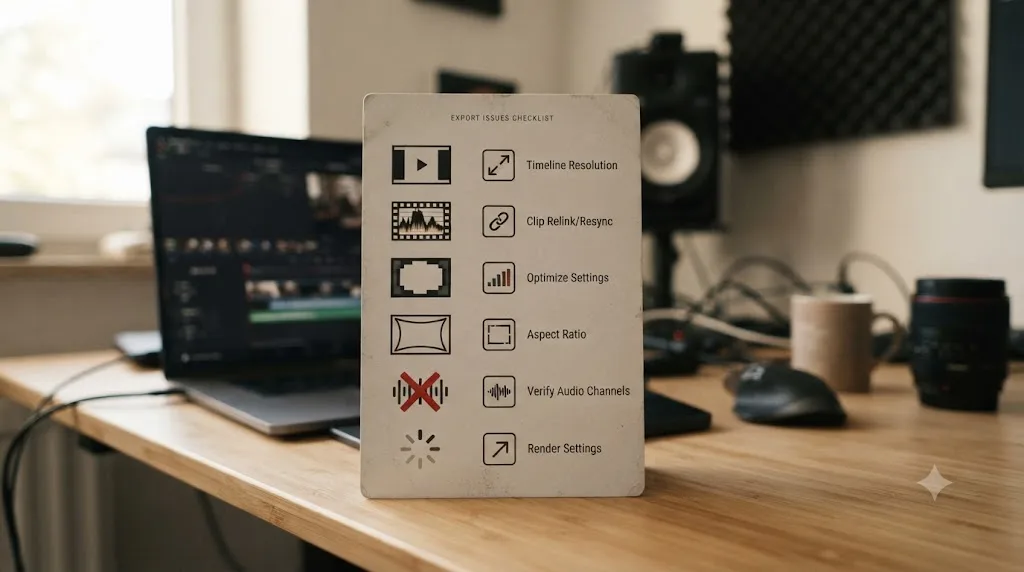
Your export is chewing through a ten-minute timeline, Task Manager says GPU is sitting at 0%, and you're half convinced DaVinci Resolve just forgot your graphics card exists. It probably didn't.
Most of the time, this is a monitoring problem wearing a hardware problem's costume. Windows' default GPU graph and DaVinci Resolve's actual encoding hardware are looking at two completely different pieces of silicon, and nobody tells you that when you open Task Manager for the first time.
What does "GPU utilization 0% during export" actually mean in DaVinci Resolve?
It means one of two very different things, and telling them apart is the entire troubleshooting job.
The first is a false reading. Your GPU's hardware encoder is working exactly as it should, but the graph you're watching in Task Manager tracks a different engine, the one used for 3D rendering and games, not the one used for video encoding. The encoder can sit at full load while that graph reads zero, forever, and nothing is wrong.
The second is a real problem. The Encoder setting on the Deliver page is pointed at your CPU instead of your GPU, your codec doesn't support hardware encoding on your platform, or your GPU genuinely isn't available to Resolve for some other reason. In that case the export really is running on the CPU alone, and it will show up as a slower render, not just a confusing number.
A 0% GPU reading during export is a claim about which engine Task Manager is watching, not a claim about what your graphics card is doing. Sort out which of the two situations you're actually in before you touch a single Resolve preference, because the fixes for each one are completely different.
Why does Task Manager show 0% GPU when Resolve is clearly using hardware encoding?
Because Windows splits every GPU into separate "engines," and Task Manager doesn't show you all of them by default.
A GPU isn't one monolithic unit. According to Microsoft's own DirectX developer blog, "a GPU engine represents an independent unit of silicon on the GPU that can be scheduled and can operate in parallel with one another," and the blog specifically calls out that "a copy engine may be used to transfer data around while a 3D engine is used for 3D rendering," per Microsoft's explanation of GPU engines in Task Manager. Video encoding lives on its own engine too, separate from 3D, separate from copy, and separate from decode.
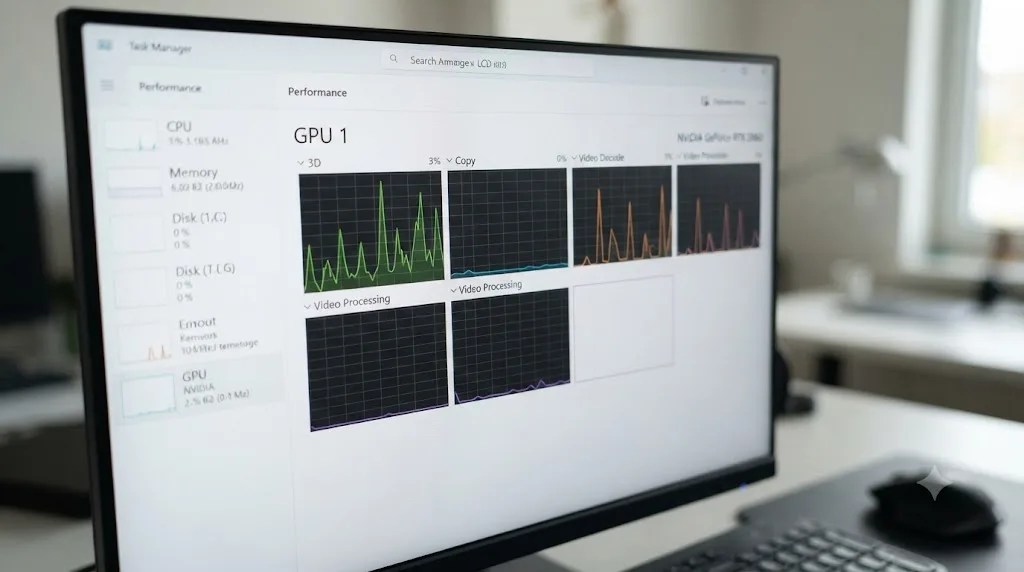
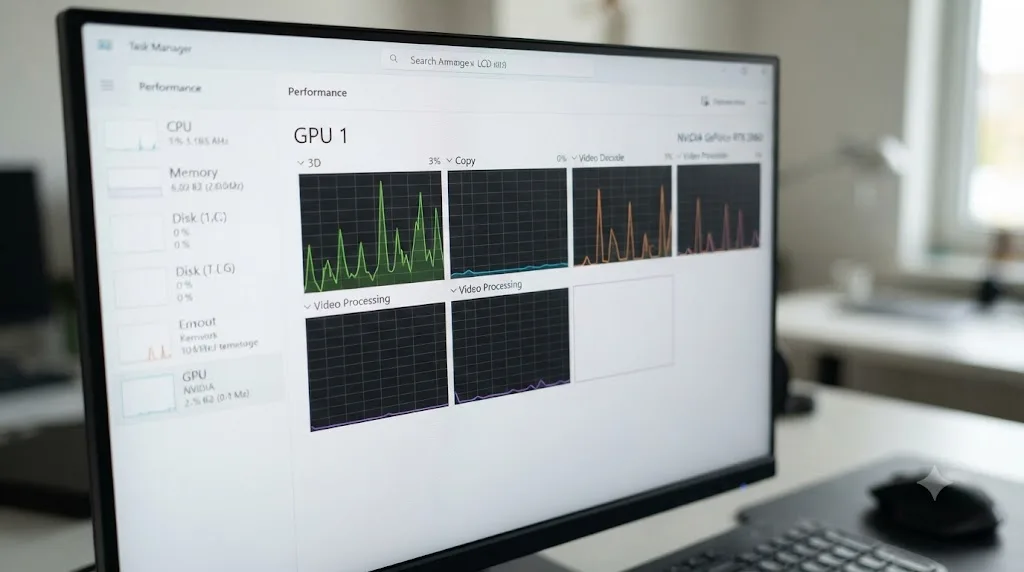
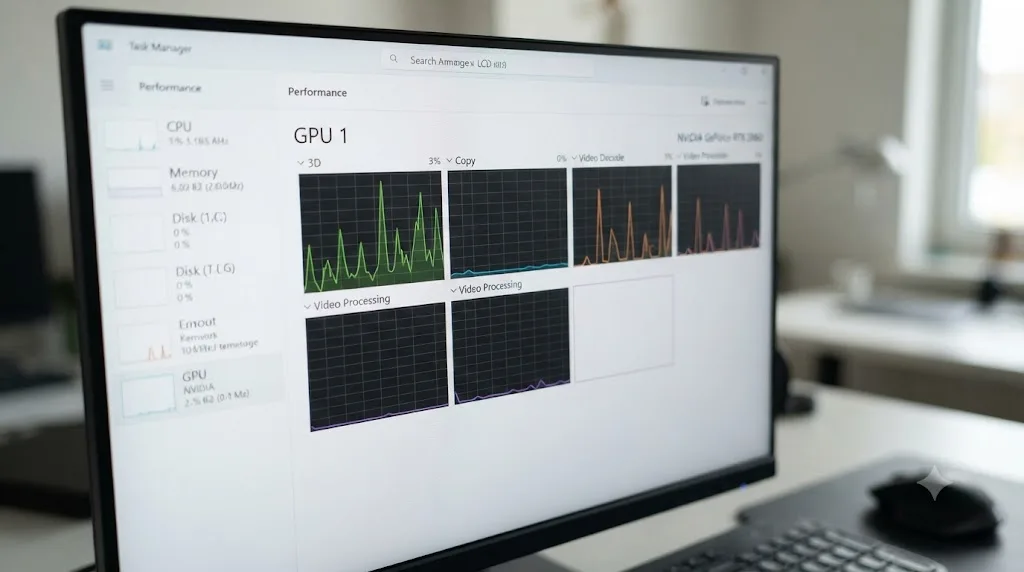
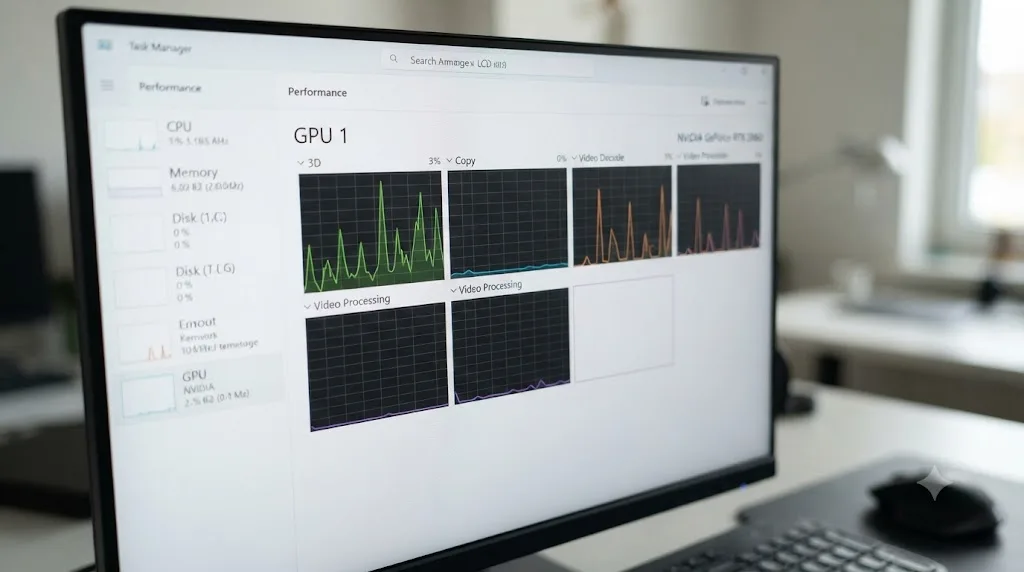
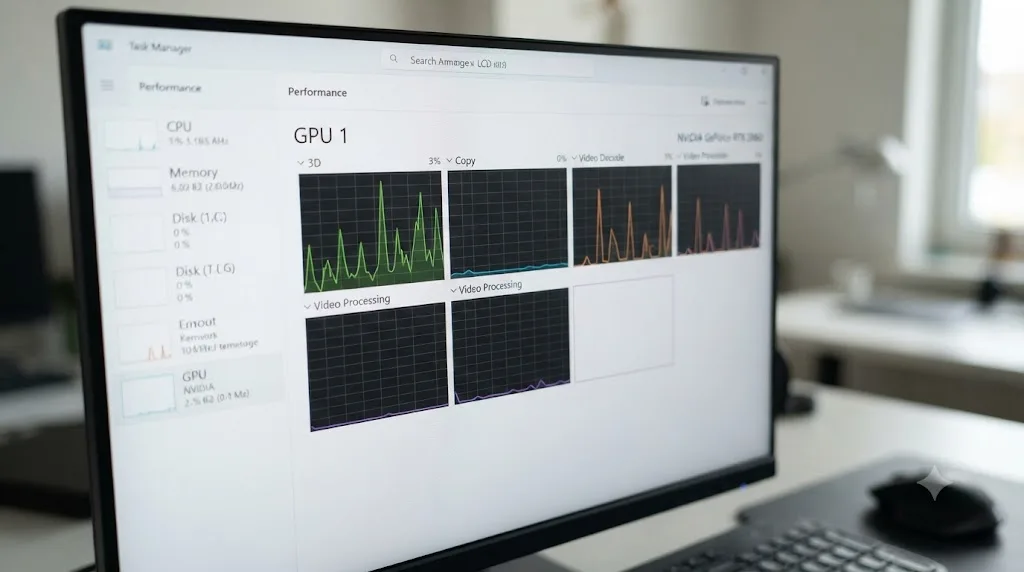
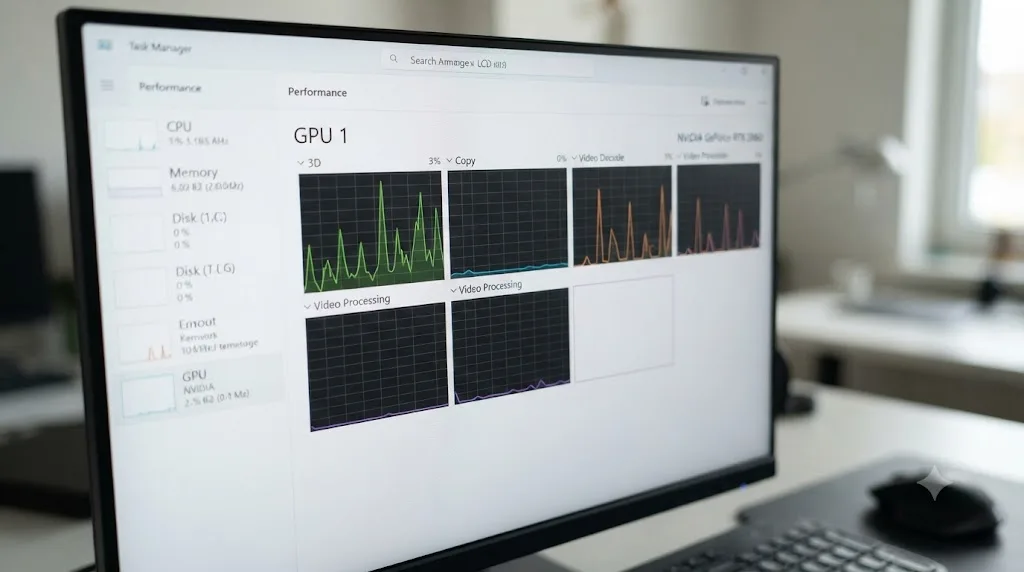
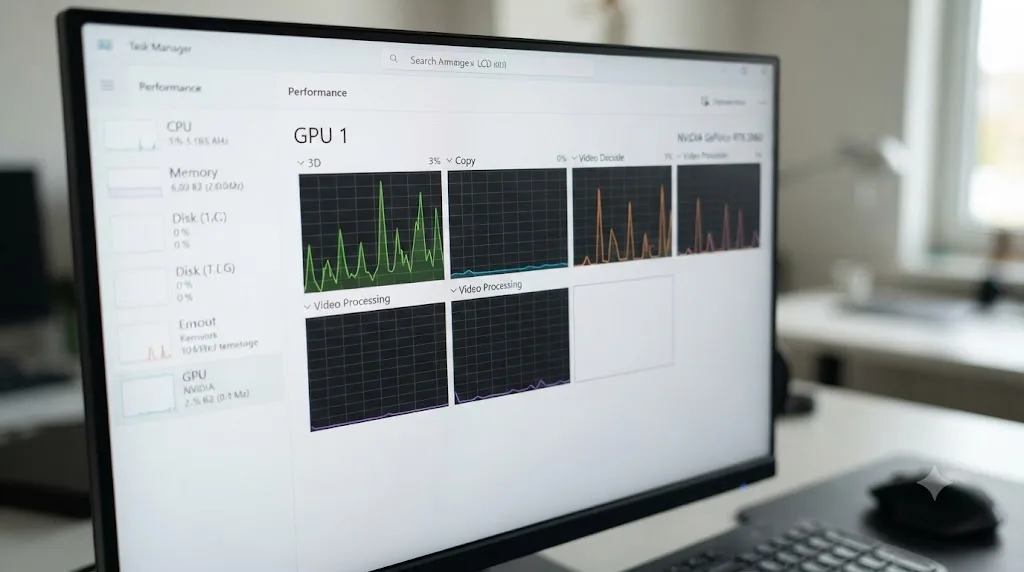
Task Manager's Performance tab shows four small graphs per GPU by default, and on most systems those four default to 3D, Copy, Video Decode, and something else that isn't Video Encode. If your GPU's overall percentage at the top of the Performance tab reads 0%, that's misleading in its own way: Microsoft's blog explains that the headline number is calculated as "the percentage utilization of the busiest engine," which sounds like it should catch encoder activity, but the catch is that this calculation only considers the engines currently selected for display. An engine you haven't added to the graph doesn't count toward that number at all.
DaVinci Resolve's hardware encoder can run at full load while every graph Task Manager shows you by default reads zero. That's not a bug in Resolve or in Windows. It's a default view that happens to hide the one engine you actually care about during an export.
How do you add the Video Encode engine to Task Manager?
Three clicks, and you'll never wonder about this again.
- Open Task Manager and click the Performance tab.
- Select your GPU from the list on the left.
- Right-click any one of the four small graphs.
- Choose "Change graph to," then select "Video Encode."
That graph now tracks the exact engine your hardware encoder drives. Start an H.264 or H.265 export with your GPU selected as Encoder on the Deliver page, and watch that graph specifically, not the default 3D graph, not the headline percentage at the top. If Video Encode climbs while 3D stays flat, your export is genuinely GPU-accelerated, and the "0%" you saw earlier was simply the wrong engine.
This same trick works in reverse for diagnosing other Resolve GPU complaints. If you're chasing a full VRAM error instead of a utilization mismatch, that's covered in depth in our GPU memory is full guide, where the relevant engine to watch is Dedicated GPU memory, not Video Encode.
Is DaVinci Resolve actually encoding with your GPU right now?
Task Manager's Video Encode graph is the fastest check, but it's not the only one, and cross-checking matters when something still looks off.
On NVIDIA hardware specifically, the command-line tool nvidia-smi gives you a more granular read than Task Manager ever will. Running nvidia-smi dmon prints live columns for streaming multiprocessor utilization, memory utilization, encoder utilization, and decoder utilization side by side, all as separate numbers, documented in NVIDIA's own System Management Interface reference. It's entirely normal to see the encoder column near 100% while the general GPU (SM) column sits at a fraction of that, because they're measuring different physical blocks on the chip. That split is the whole story of this article compressed into one command's output.
AMD's equivalent is its Adrenalin software's built-in performance overlay, which separately reports "Media Encode" alongside general GPU usage on Radeon cards, so you're not stuck squinting at Task Manager if you'd rather watch AMD's own numbers.
The most reliable way to confirm hardware encoding is happening is to watch the encoder-specific number, whichever tool reports it, not the general GPU percentage any tool shows by default. General GPU usage and encoder usage are different measurements of different hardware, and conflating them is exactly what produces a "0%" scare during an otherwise normal export.
If you'd rather not run a command-line tool at all, there's a low-tech version of the same test: time the export with your GPU selected as Encoder, then time it again with Encoder switched to Native. According to a Puget Systems video walkthrough by Peter Emery, there's no built-in indicator inside Resolve itself for this, since "there is no way to directly tell if Resolve is using hardware decoding when processing your media," as explained in Puget's guide to checking hardware acceleration in DaVinci Resolve. A meaningfully faster GPU-encoded pass confirms the hardware path is real, even without a percentage to look at.
Which Encoder setting controls GPU use on the Deliver page?
One dropdown, and it's easy to miss because it sits inside a collapsed section.
Open the Deliver page, pick your export preset or format, and expand the Video tab if it isn't already open. Next to your codec (H.264 or H.265), there's an Encoder field. On a system with a supported GPU, it offers Native alongside your GPU manufacturer's name, Nvidia, AMD, or Intel depending on what Resolve detects. Native means CPU encoding, full stop, regardless of what your graphics card is capable of.
| Encoder setting | What actually encodes the frame |
|---|---|
| Native | The CPU, in software, every time |
| Nvidia | NVENC, NVIDIA's dedicated encoder block |
| AMD | AMD's VCN/AMF encoder block |
| Intel (where offered) | Intel Quick Sync's media engine |
| Auto (Mac only) | Apple silicon's media engine, chosen automatically |
If Encoder reads Native, DaVinci Resolve is not touching your GPU's encoder at all, on purpose, and no Task Manager setting will make it appear. That's not a bug to fix. It's a choice to change, by picking your GPU from the same dropdown.
Native gets selected more often than people realize, usually left over from a previous export of a codec that doesn't support hardware encoding (more on that below), or because a system genuinely doesn't offer a GPU option in the first place. Either way, check this dropdown before you check anything else, since it answers the entire question in one glance.
Does your Resolve edition change whether the GPU encodes at all?
Yes, and this is the single most common reason the GPU option is missing entirely rather than just unselected.
On Windows and Linux, GPU-accelerated H.264 and H.265 encoding through NVENC or AMD's encoder is a DaVinci Resolve Studio feature. The free version on those two platforms encodes H.264 and H.265 in software on the CPU, no matter how capable your graphics card is, and no Encoder dropdown showing your GPU will appear because Resolve genuinely doesn't offer it. This split is covered in detail in Puget Systems' breakdown of which hardware decoding is supported in DaVinci Resolve Studio, and the same Studio-only line applies to encoding, not just decoding.
Mac breaks that pattern. The free version of DaVinci Resolve on Apple silicon does use the Mac's hardware media engine for H.264 and H.265, both decode and encode, because that acceleration lives at the operating system level through Apple's VideoToolbox framework rather than being gated inside Resolve's own licensing.
| Platform | Free version GPU encode (H.264/H.265) | Studio GPU encode |
|---|---|---|
| Windows | No, software only | Yes, via NVENC or AMD encoder |
| Linux | No, software only | Yes, via NVENC or VAAPI |
| macOS (Apple silicon) | Yes, via the media engine | Yes, same hardware path |
A missing GPU option in the Encoder dropdown on Windows or Linux free-version Resolve isn't a driver problem or a detection failure, it's the license working exactly as designed. Confirm which edition you're running, from the Resolve splash screen or Help menu, before spending an evening on driver reinstalls that were never going to add a feature the free tier doesn't include.
Which export codecs actually use the GPU encoder, and which never do?
This is the part that trips up experienced editors too, because the assumption that "GPU acceleration" is one on/off switch for the whole export doesn't hold.
Hardware encoder blocks, NVENC, AMD's VCN, Intel Quick Sync, Apple's media engine, are built for specific, tightly standardized codecs. H.264 and H.265 fit that mold. ProRes and DNxHR don't, at least not on Windows and Linux GPUs, because there's no equivalent dedicated hardware block for them the way there is for the two delivery codecs everyone streams video with.
| Codec | GPU hardware encoder available? |
|---|---|
| H.264 | Yes, on supported GPUs with Studio (or free on Mac) |
| H.265 (HEVC) | Yes, same conditions as H.264 |
| ProRes | No dedicated GPU encoder block on Windows/Linux; CPU-encoded (Apple silicon Macs encode ProRes on the media engine) |
| DNxHR | No, always CPU-encoded regardless of platform |
| Uncompressed / TIFF sequences | No, CPU/disk-bound, not encoder-bound at all |
Exporting ProRes or DNxHR and seeing 0% on the Video Encode engine is completely expected, not a symptom of anything broken. Those codecs were never going to touch that engine in the first place, on Windows or Linux, so checking the encoder graph during a ProRes master export tells you nothing useful. Save that check for H.264 and H.265 exports specifically, where a hardware path genuinely exists to verify.
This distinction also explains a pattern that confuses people who export both an H.265 delivery file and a ProRes archive master from the same timeline: Video Encode spikes on one render and stays flat on the very next one, same project, same machine, same day. Nothing changed except the codec, and the codec is exactly what decides whether that engine has any work to do.
What if GPU utilization is genuinely 0%, not just misread?
Work through these in order once you've confirmed, via Video Encode in Task Manager or nvidia-smi dmon, that the encoder really isn't engaging on an H.264 or H.265 export.
Check the Encoder dropdown first. If it reads Native, switch it. This alone resolves the majority of genuine cases, and it's the fastest check on the list.
Confirm your edition supports it. Free version, Windows or Linux, H.264/H.265: no GPU encoder option exists, and that's by design, not a fault to troubleshoot.
Check GPU Selection in Preferences. Open Preferences > System > Memory and GPU and confirm your dedicated card, not an integrated chip, is selected. A laptop with hybrid graphics can leave Resolve talking to the wrong GPU entirely, the same routing problem covered in our AMD GPU not detected guide, and an encoder that isn't detected can't show usage on any engine.
Update your GPU driver directly from the manufacturer. NVIDIA, AMD, and Intel all ship encoder support through the driver, and an outdated or partially installed driver can silently drop the hardware encoding option from Resolve's Encoder dropdown without any error message explaining why.
Rule out a genuinely unsupported codec configuration. Some bit-depth and chroma subsampling combinations, 10-bit 4:2:2 H.265 at certain resolutions, for instance, fall outside what a given GPU generation's encoder block supports, and Resolve quietly falls back to Native rather than failing loudly. If Encoder shows your GPU as an option but the export still shows zero encoder activity, try a simpler configuration, 8-bit 4:2:0, to see if the encoder engages there instead.
Check whether the render itself is failing rather than just running on CPU. If the export is stuck, not just slow, that's a different problem with a different fix path, covered start to finish in our render stuck or failed guide.
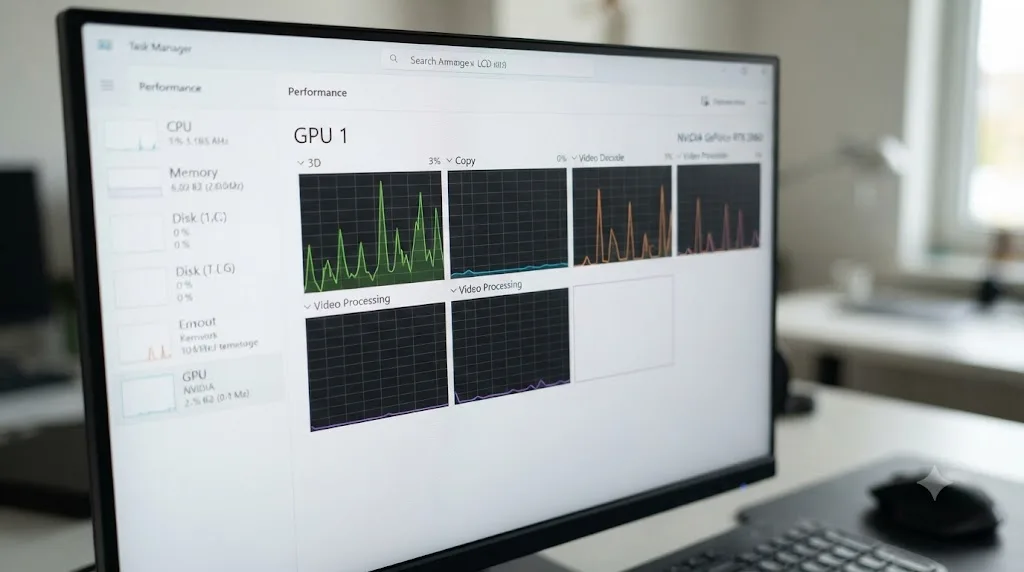
Why does compute or 3D usage stay near 0% even during a real hardware-accelerated export?
Because encoding and 3D compute aren't the same job, and modern GPUs give each one its own dedicated silicon rather than sharing a single pipeline.
NVIDIA's own Video Codec SDK documentation is explicit about this: NVENC "provides fully accelerated hardware-based video encoding and is independent of graphics/CUDA cores," which means it can run flat out while the part of the chip most utilization tools default to showing, the 3D or CUDA cores, sits untouched, per NVIDIA's NVENC Application Note. The same document adds that "in the video transcoding use-case, video encoding/decoding can happen on NVENC/NVDEC in parallel with other video post-/pre-processing on CUDA cores," describing two separate engines doing two separate jobs at the same time, each with its own utilization number.
A hardware video encoder is a separate, purpose-built circuit on the GPU, not a repurposed slice of the same cores that render 3D graphics or run compute shaders. That's precisely why watching the 3D engine, the one Task Manager defaults to, during an H.265 export tells you almost nothing about whether hardware encoding is happening. You're watching the wrong part of the chip.
This is also why a powerful gaming GPU with an idle 3D engine can still encode an export in a fraction of the time a weaker GPU with no dedicated encoder takes on the same file, and why running a completely unrelated GPU-heavy task, a game, an AI workload, alongside an export doesn't necessarily slow the export down. They're using different silicon on the same card, so they genuinely can run in parallel without fighting each other for the same execution units.
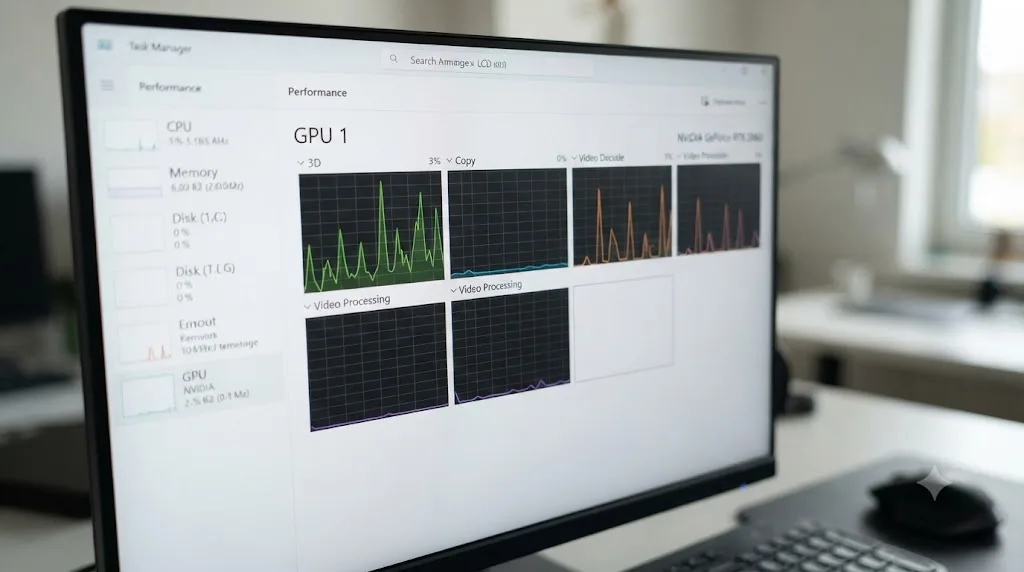
Does 0% GPU utilization mean your export is slow or broken?
Not automatically. The reading and the outcome are two separate questions, and answering the second one is what actually matters.
Time the export. If a ten-minute 4K H.265 timeline exports in a couple of minutes, that's not a CPU-only render, whatever Task Manager's default graph said. Hardware encoders are fast enough that the export time itself becomes the real tell, faster than software encoding could plausibly manage on the same file at the same bitrate. In that case, the 0% you saw was a monitoring artifact, and adding the Video Encode engine to Task Manager, or running nvidia-smi dmon, will confirm it retroactively.
If the same export instead crawls, minutes per second of footage rather than the reverse, and the Encoder dropdown genuinely reads Native or has no GPU option, that's a real CPU-bound render, and the fixes are the checklist two sections up: switch the Encoder setting, confirm your edition supports GPU encoding for that codec, check GPU Selection, update the driver.
Export time is a more honest signal than any single utilization percentage, because it reflects the actual work getting done rather than which engine a monitoring tool happened to be watching. When the two disagree, trust the stopwatch and go looking for why the percentage lied, not the other way around.
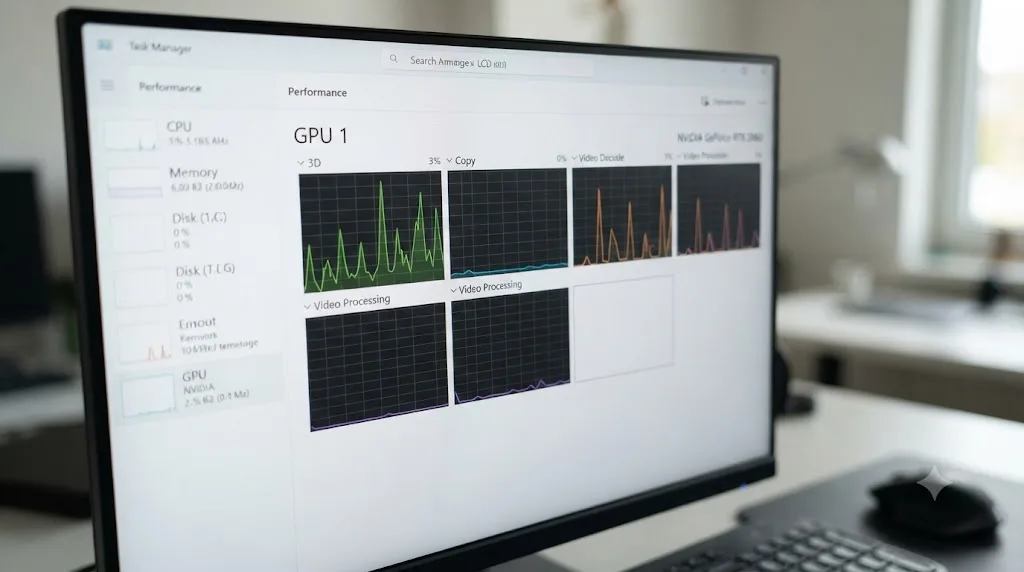
How do you check real GPU usage on Windows outside Task Manager?
Task Manager's Video Encode graph is the easiest fix for most people, but it's not the deepest tool available, and a couple of alternatives are worth knowing if you want a second opinion.
nvidia-smi dmon, run from a Command Prompt or PowerShell window on any system with an NVIDIA driver installed, prints live, separate columns for SM (general compute), memory, encoder, and decoder utilization, refreshing every second by default, documented in NVIDIA's System Management Interface reference. It's the most direct confirmation available on NVIDIA hardware, since it's reading the same counters the driver itself tracks, not a Windows-level abstraction of them.
AMD's Adrenalin software includes a performance overlay with a "Media Encode" readout alongside the general GPU number, accessible without any command line at all, and it updates live during a Resolve export exactly the way Task Manager's Video Encode graph does, just inside AMD's own interface instead of Windows'.
Third-party tools like GPU-Z and HWiNFO also expose per-engine sensors on most modern cards, useful if you want a persistent on-screen overlay rather than switching to Task Manager mid-export to check.
None of these tools disagree with each other on a healthy system, they just present the same underlying encoder activity through different interfaces. Pick whichever one is fastest to reach when you're mid-export and need an answer, Task Manager for a quick look, nvidia-smi dmon or AMD's overlay for something more precise.
How do you check real GPU usage on a Mac during export?
Differently, and with less precision than Windows offers, which is worth knowing before you go looking for a Video Encode graph that doesn't exist on macOS.
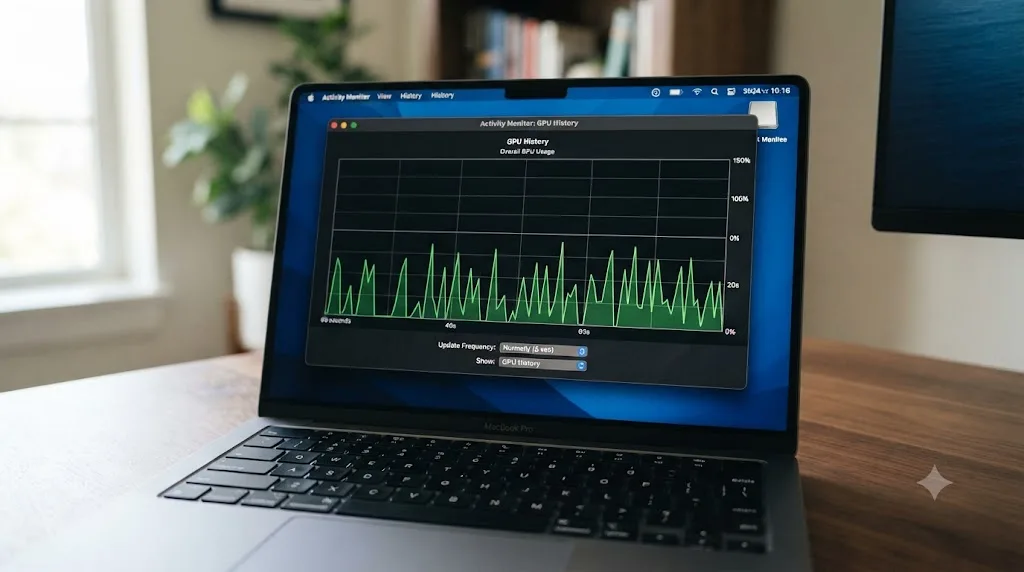
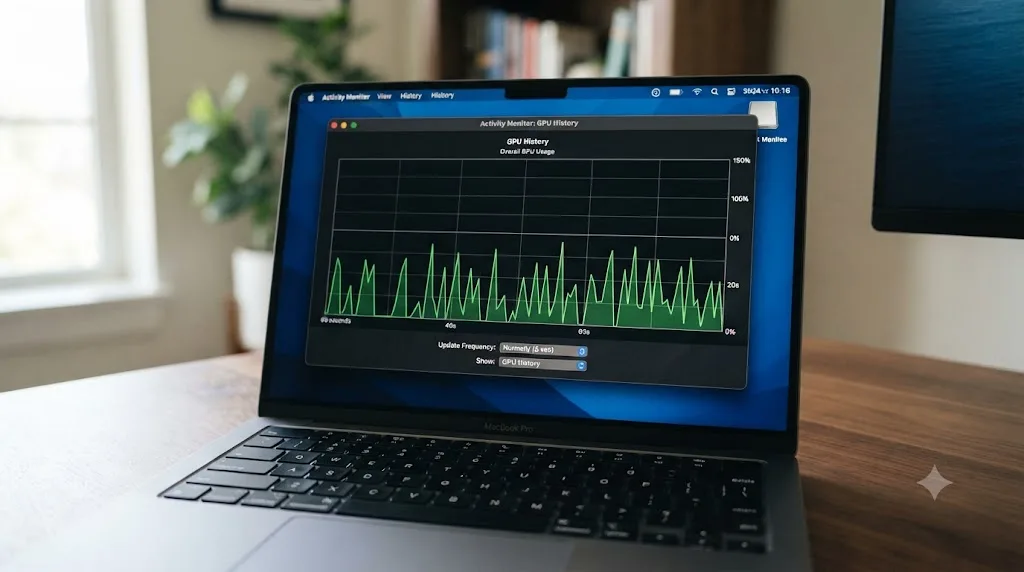
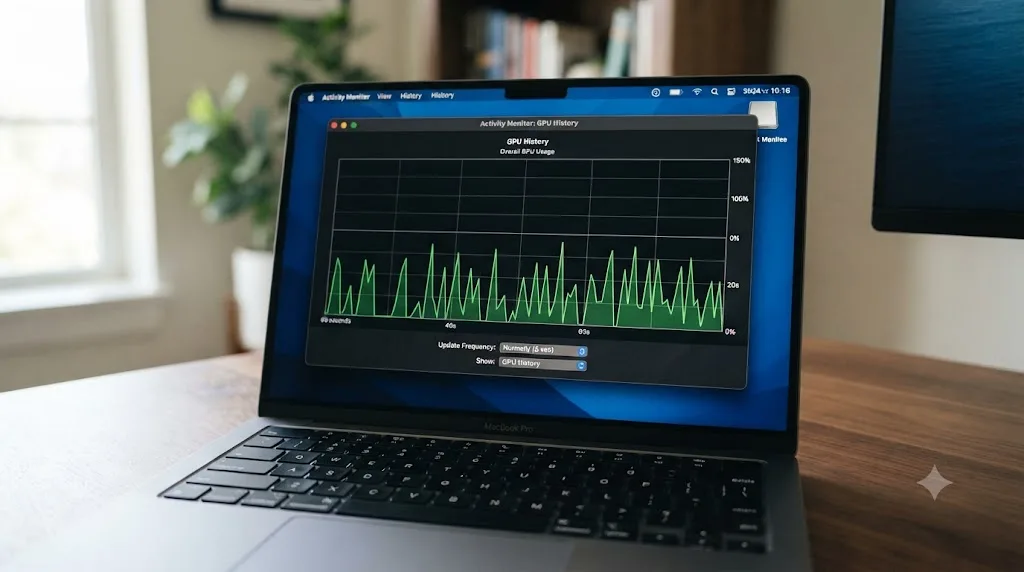
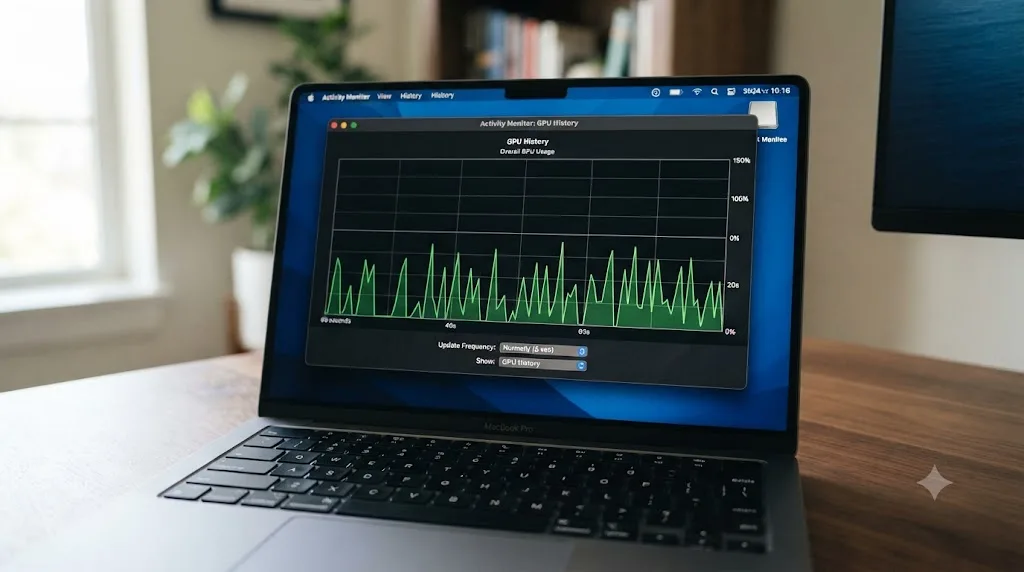
Activity Monitor's GPU History window, opened through Window > GPU History, shows one general activity graph per GPU, per Apple's own support documentation for Activity Monitor. There's no per-engine breakdown the way Windows' Task Manager offers one, no way to isolate "media engine" from "GPU cores" in the built-in interface, because Apple doesn't expose that split at the same level of detail.
That matters specifically for exports, because Apple silicon's H.264 and H.265 hardware acceleration runs through a dedicated media engine, a separate block from the GPU cores Activity Monitor's graph is generally reflecting, the same conceptual split as NVENC versus CUDA cores on a Windows machine, just without a Windows-style dashboard to prove it. A modest-looking number in Activity Monitor's GPU History during an H.265 export on an M-series Mac doesn't mean hardware encoding failed. It likely means the media engine, not the general GPU graph, did the work, and that engine simply isn't broken out separately in the stock tool.
For a more detailed reading, Terminal's sudo powermetrics --samplers gpu_power reports GPU utilization percentage and power draw with more granularity than Activity Monitor's graph, though it still doesn't isolate the media engine specifically the way nvidia-smi dmon isolates NVENC on a Windows machine with an NVIDIA card.
On Apple silicon, the absence of a separate Video Encode graph isn't a limitation of your export, it's a limitation of the monitoring tool, and it's the mirror image of the Windows problem this whole guide describes. If you're on an M4-class Mac and want the fuller picture of what settings matter for export speed and hardware acceleration on that platform specifically, our Apple Silicon M4 settings guide covers it in depth.
What does this look like on a real machine, start to finish?
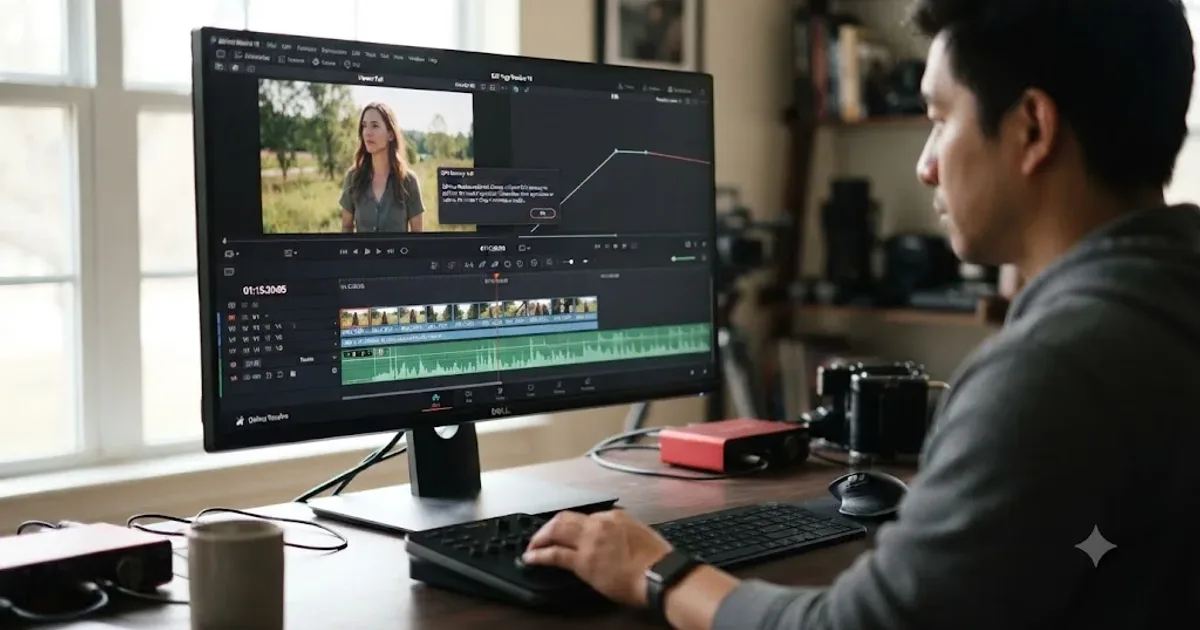
Take a common report and walk it end to end. A Windows desktop, an RTX 4070, DaVinci Resolve Studio, exporting an H.265 MP4 from a 4K timeline. Task Manager's default GPU graph reads 0% the entire time, and the export is taking what feels like forever.
Start with the Encoder dropdown on the Deliver page. It reads "Nvidia," not Native, so the GPU is at least selected as the intended encoder. That rules out the single most common real cause.
Next, add the Video Encode engine to Task Manager: Performance tab, select the GPU, right-click a graph, Change graph to, Video Encode. Re-run a short test export of the same timeline. The Video Encode graph climbs to 60 to 80 percent for the export's duration, while the default 3D graph everyone was staring at earlier stays close to flat. That confirms hardware encoding is genuinely running, and the "0%" that started this whole investigation was Task Manager showing the wrong engine the entire time.
So why did the export still feel slow? Time it against a rough expectation: hardware H.265 encoding on an RTX 4070 should chew through a 4K timeline considerably faster than real-time for most content. If the actual export time lines up with that expectation, there was never a performance problem at all, just a misleading number. If it's still unusually slow despite the encoder engaging, the bottleneck has moved somewhere else entirely, heavy Fusion nodes or noise reduction still computing live during the render, a slow destination drive, or the source codec's decode side struggling, which is a separate investigation from the encoder question this guide answers.
In this example, the fix wasn't a setting change at all. It was watching the correct graph. That's the single most common resolution to a "0% GPU during export" report, and it costs three clicks in Task Manager to confirm, before you touch a driver, a preference, or a codec setting.
What's the full troubleshooting order for a "0% GPU during export" report?
Work through it in this order and stop the moment you've got an answer, whether that answer is "it's fine" or "here's the real fix":
- Confirm your export codec is H.264 or H.265. ProRes and DNxHR never touch the GPU encoder on Windows or Linux, and 0% there is expected, not a symptom.
- Check the Encoder dropdown on the Deliver page. Native means CPU, on purpose, no matter what your GPU can do.
- Add the Video Encode engine to Task Manager, Performance tab, right-click a graph, Change graph to, Video Encode, and re-check during a short test export.
- Time the export. A fast render with the "wrong" engine reading 0% is a monitoring artifact. A genuinely slow render is a real problem.
- Confirm your Resolve edition supports GPU encoding for that codec on your platform, since free-version Windows and Linux users won't see a GPU option at all.
- Check GPU Selection in Preferences > System > Memory and GPU, and confirm your dedicated card, not integrated graphics, is chosen.
- Update your GPU driver directly from NVIDIA, AMD, or Intel if the hardware encoder option is missing or the encoder still won't engage despite everything above checking out.
If you've worked through all seven and the encoder genuinely never engages on a system and edition that should support it, that's the point to treat it as a driver or GPU Selection problem rather than a monitoring one, and the deeper GPU detection troubleshooting in our AMD GPU not detected guide applies just as well to NVIDIA and Intel hardware showing the same "Resolve won't use my GPU" symptom.
If working through Task Manager engines and Encoder dropdowns isn't how you want to spend an afternoon, that confusion between what a menu says and what your hardware is actually doing is exactly the gap TryUncle exists to close. TryUncle is an AI tutor for DaVinci Resolve on macOS - ask in plain words and Uncle points at the exact control on your screen. It watches your actual Deliver page and tells you whether Encoder is set to your GPU or to Native, instead of you cross-referencing a guide against a screenshot that doesn't quite match your version. It's a paid app in founder pricing, not a free tool, and macOS only, so it won't read a Windows Task Manager for you, but if the same "is this actually doing what I think it's doing" confusion is slowing you down anywhere else in Resolve, on the Edit, Color, or Fusion page, TryUncle is built for exactly that gap. Check tryuncle.com for the current rate before assuming it fits your setup.
The short version worth remembering: a 0% reading during export is a claim about which engine a monitoring tool decided to show you, not a verdict on your hardware. Check the codec, check the Encoder dropdown, add Video Encode to Task Manager, and time the export. Most of the time, your GPU was never idle. It was just working somewhere Task Manager wasn't looking.
Frequently asked questions
- Why does Task Manager show 0% GPU while DaVinci Resolve is exporting?
- Because Task Manager's default GPU graph tracks whichever engine you last had selected, usually the 3D engine, and DaVinci Resolve's hardware encoder runs on a separate block called the Video Encode engine. If that engine isn't one of the four graphs shown by default, real encoder activity never shows up, even at full load.
- How do I see the actual GPU encoder usage in Task Manager?
- Open Task Manager, click Performance, select your GPU, then right-click any of the four small graphs and choose Change graph to, then Video Encode. That swaps in the engine DaVinci Resolve's hardware encoder actually uses, and it will show real activity during an H.264 or H.265 export instead of a flat 0%.
- Does 0% GPU utilization during export mean the render is broken?
- Not by itself. Check whether the export is still finishing in a reasonable time first. A fast export with a misleading 0% reading is a Task Manager display problem. A genuinely slow export with 0% GPU on every engine means the render really is running on the CPU, usually because the Encoder dropdown on the Deliver page is set to Native instead of your GPU.
- Why is the Encoder dropdown set to Native and not my GPU?
- Either you're running the free version of DaVinci Resolve on Windows or Linux, where GPU-accelerated H.264 and H.265 encoding is a Studio-only feature, or Native was left selected from a previous export. Open the Deliver page, expand Video, and check the Encoder field next to your codec before you check anything else.
- Do ProRes and DNxHR exports ever show high GPU encoder usage?
- No, and that's expected, not a bug. ProRes and DNxHR are intermediate codecs without a dedicated hardware encoder block on Windows or Linux GPUs, so DaVinci Resolve encodes them in software on the CPU regardless of your Encoder setting. Only H.264 and H.265 route through NVENC, AMD's encoder, or Intel Quick Sync.
- Why does GPU usage stay low during export even when I know hardware encoding is on?
- Because the hardware encoder is physically separate silicon from the GPU's compute or 3D cores, the part most utilization graphs default to showing. NVIDIA's own documentation describes NVENC as hardware that provides accelerated video encoding and is independent of the graphics and CUDA cores, so it can run at full tilt while the 3D engine you're watching sits nearly idle.
- Is this different on a Mac with Apple silicon?
- Yes. Apple silicon has no separate Task Manager engine list at all. Activity Monitor's GPU History window shows one general graph with no per-engine breakdown, so you can't isolate the media engine the way Windows lets you isolate Video Encode. A low number in Activity Monitor during an H.264 or H.265 export on an M-series Mac is normal, since the dedicated media engine, not the general GPU cores, is doing the work.
Sources
- NVIDIA Video Codec SDK: NVENC Application Note
- GPUs in the Task Manager (Microsoft DirectX Developer Blog)
- Puget Systems: Is Your Footage Hardware Accelerated in DaVinci Resolve? (Peter Emery)
- Puget Systems: What H.264 and H.265 Hardware Decoding is Supported in DaVinci Resolve Studio?
- Puget Systems: Hardware Recommendations for DaVinci Resolve
- DaVinci Resolve - Tech Specs (Blackmagic Design)
- Apple Support: View GPU activity in Activity Monitor on Mac
- NVIDIA System Management Interface (nvidia-smi) documentation
- Blackmagic Forum: Discrete GPU encoding not being used
Put this guide to work with TryUncle.
Ask about the step you’re on. TryUncle sees your screen and points at the control you need, so you can keep learning in your own project.
Get TryUncle for Mac or WindowsKeep reading
Fixes · Jul 7, 2026 · 25 min
DaVinci Resolve GPU Memory Is Full: Every Real Fix
Why DaVinci Resolve throws 'GPU memory is full,' and which fixes actually work: timeline resolution, drivers, effects, and how much VRAM you need.
Fixes · Jul 17, 2026 · 23 min
DaVinci Resolve AMD GPU Not Detected: Every Real Fix
DaVinci Resolve not seeing your AMD GPU? Here's why it happens on Windows, Mac, and Linux, and the exact driver, preference, and Windows fixes that work.
Fixes · Jul 7, 2026 · 24 min
DaVinci Resolve Not Exporting? Fix a Stuck or Failed Render
Why DaVinci Resolve renders get stuck at 0% or 99%, or fail with no error, and the exact checks that get a stalled export moving again.