Articles / Fixesupdated for DaVinci Resolve 21.0.2 (July 2026)
DaVinci Resolve High CPU Usage but Low GPU Usage, Explained
Quick answer
High CPU with low GPU almost always means DaVinci Resolve is decoding your footage in software instead of hardware, usually H.264/H.265 long-GOP media your setup can't hardware-decode, the free version's decode limits, or unset Decode Options. Turn on hardware acceleration in Preferences > Decode Options, or transcode to ProRes/DNxHR to move the work back off the CPU.
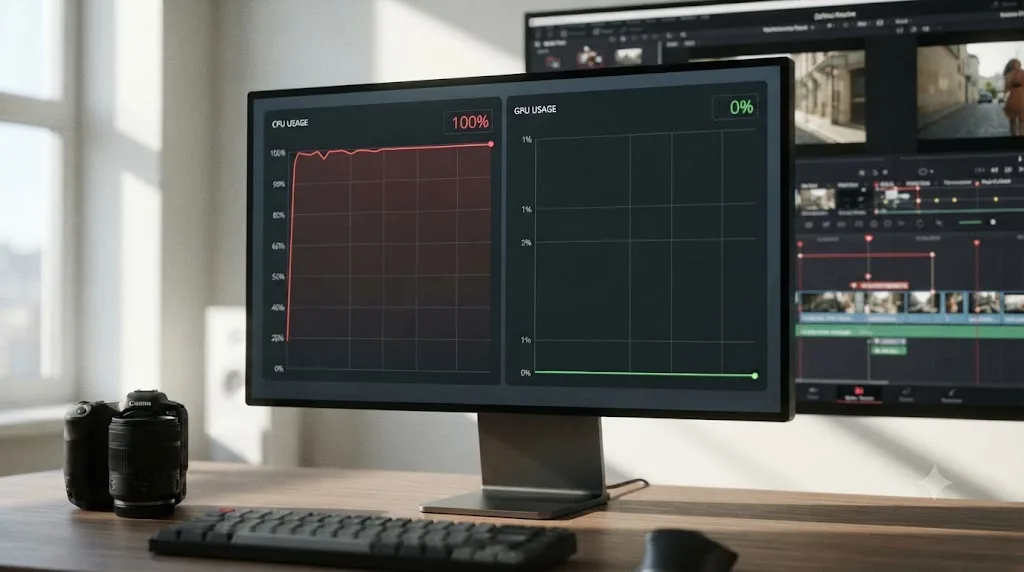
Your fans are screaming, Task Manager or Activity Monitor shows the CPU pinned near 100%, and right next to it the GPU graph is barely moving. You bought a real graphics card for this. It should be doing something.
It probably wants to. Most of the time, DaVinci Resolve isn't ignoring your GPU out of spite. It's decoding your footage in software because something, your codec, your Resolve edition, a preference, or an unsupported bit depth, is quietly routing that job to the CPU instead.
What does "high CPU usage but low GPU usage" mean in DaVinci Resolve?
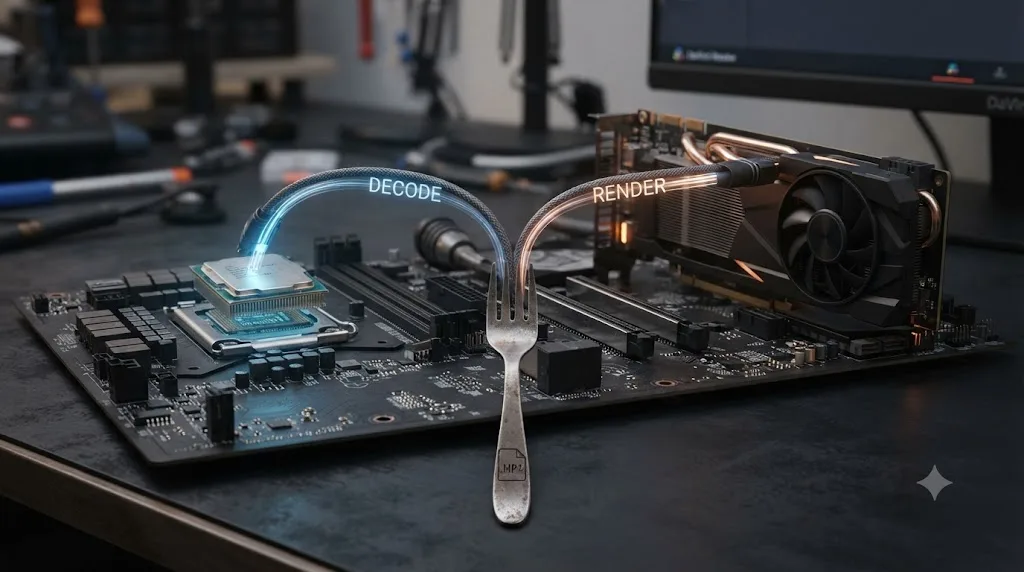
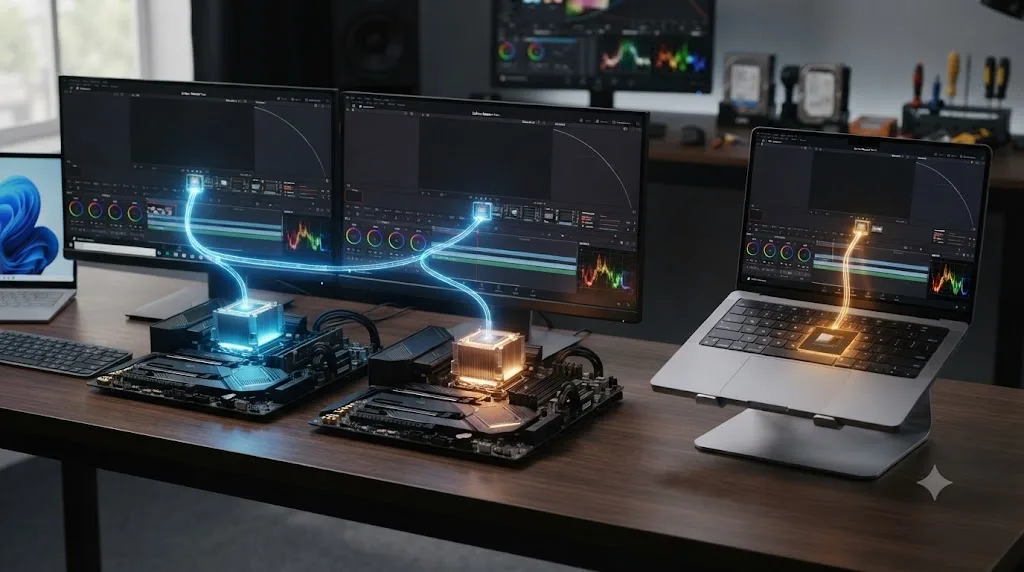
It means the two halves of Resolve's pipeline are wildly out of balance. Decoding, turning a compressed video file back into pixels, and rendering, applying your grade, effects, and titles to those pixels, are two separate jobs that can run on two separate pieces of hardware. When you see this pattern, decoding has landed almost entirely on your CPU, and your GPU is left with comparatively little to do.
A busy CPU next to an idle GPU is DaVinci Resolve telling you exactly where the bottleneck lives: decode, not render. That's the single most useful fact in this whole article, because it tells you where to look first. You're not chasing a broken graphics card. You're chasing a decoding pipeline that isn't using the one it has.
This isn't unique to Resolve. Any application that plays back compressed video has to make the same choice between software and hardware decoding, and the wrong choice looks identical everywhere: fans spinning up, a laggy timeline, and a GPU that seems to be on vacation. What makes Resolve's version confusing is how many separate settings, editions, and codec quirks all feed into that one choice.
Why does DaVinci Resolve rely on the CPU at all if I have a GPU?
Because decoding compressed video and applying a color grade are fundamentally different kinds of work, and Resolve was built to hand each one to whichever processor does it best, not to run everything through the GPU by default.
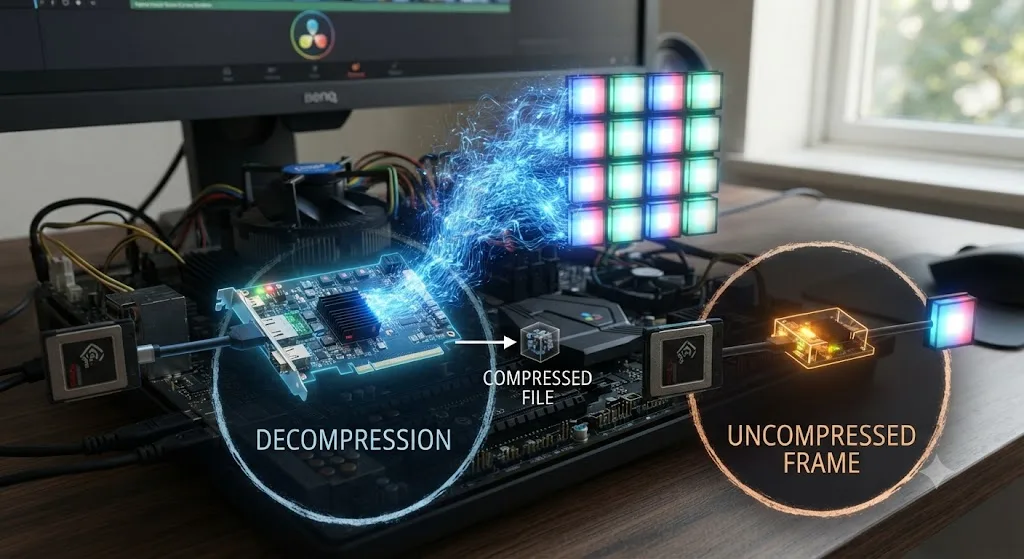
Your camera doesn't record raw pixels. It records a compressed stream, and reversing that compression back into full-resolution, full-bit-depth pixel data is genuinely expensive. Older versions of Blackmagic's own configuration guides put a number on it: compressed footage needs to be decompressed to full RGB per pixel bit depth, and that step alone can demand four times or more the processing power a comparable uncompressed HD image would need for the same real-time performance. That decompression step is decoding, and on most systems it defaults to the CPU unless something specific tells Resolve to hand it to a GPU instead.
Once a frame is decoded, the story flips. Nodes, color wheels, qualifiers, noise reduction, all of that math runs far more efficiently on a GPU's thousands of parallel cores than on a CPU's much smaller number of general-purpose ones. That's why a healthy Resolve session usually looks like moderate CPU use and heavier GPU use once you're actually grading. High CPU with low GPU flips that expectation, and it flips it specifically at the decode stage, before your grade even gets a chance to run.
Puget Systems, which builds and benchmarks workstations specifically for DaVinci Resolve, frames the split plainly: while Resolve heavily relies on GPU performance, especially with OpenFX or noise reduction in play, the processor remains a critical component too, and the firm notes that more complex projects with OpenFX and noise reduction are often influenced more by GPU performance than CPU, which by implication means simpler projects, the ones without heavy effects, lean the other way, per Puget Systems' hardware recommendations for DaVinci Resolve. Bare media playback and a simple grade sit closer to the CPU-bound end of that spectrum than most editors expect.
Is your footage the reason? How compressed codecs shift work to the CPU
Nine times out of ten, yes, and the codec is the first thing worth checking before you touch a single preference.
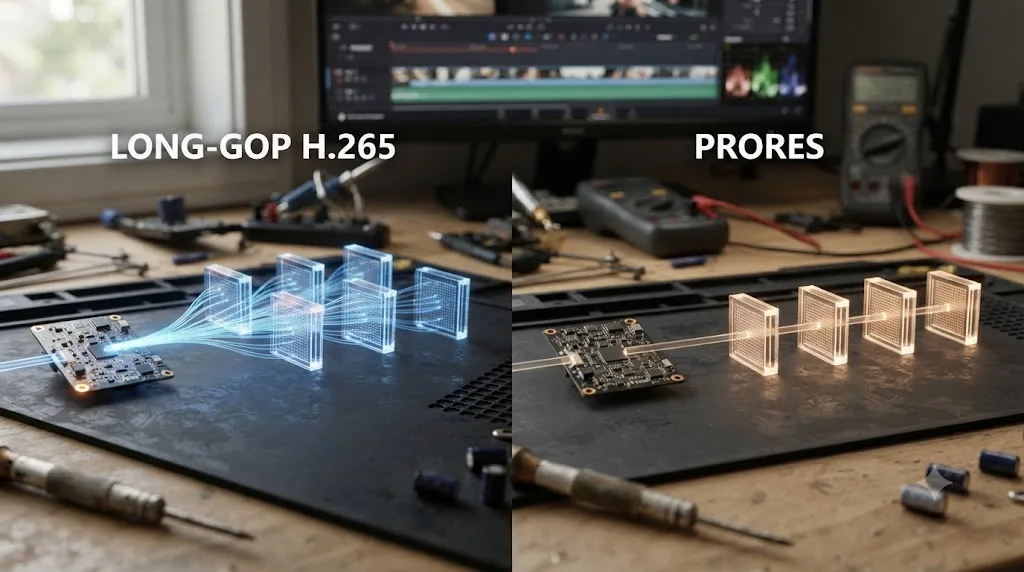
H.264 and H.265 (HEVC) are long-GOP codecs. Instead of storing every frame as a complete image, they store a handful of full frames and reconstruct everything in between from the differences, which is exactly what makes them so efficient at compressing footage down to a small file size. It's also exactly what makes them expensive to decode, since reconstructing frame six might mean walking back through frames one through five first. Video professional Richard Lackey put it directly in his breakdown of why AVC and HEVC punish editing performance: once you've transcoded to an intermediate codec, "since all the decoding of the source files has been done, Resolve no longer has to rely on the CPU to do it in real-time," as explained in Richard Lackey's guide to transcoding AVC, H.264, and HEVC for DaVinci Resolve. That sentence is the whole problem in reverse: until you transcode, Resolve does have to rely on the CPU to do it in real time, on every single scrub, every single playhead move, every single frame of playback.
This is exactly why 4K 30fps or 60fps H.265 from a phone or a consumer drone brings capable desktops to a crawl. The file looks small on disk. The decoding demand it places on your system has nothing to do with file size and everything to do with how tightly it's compressed.
| Codec type | Typical decode cost | GPU hardware decode available? |
|---|---|---|
| H.264 / H.265, long-GOP, camera or phone footage | High | Only on specific GPU generations, and only certain bit depth/chroma combinations |
| ProRes, DNxHR (intermediate codecs) | Low | Not needed; these decode cheaply on CPU by design |
| RAW (BRAW, R3D, ARRIRAW) | Very high, debayer-dependent | Partial, and debayer quality setting matters more than GPU decode |
| Uncompressed / image sequences | Minimal decode, disk-bound instead | Not applicable |
Notice that the "fix" for ProRes and DNxHR isn't GPU decoding at all. Those codecs were designed to decode cheaply on the CPU in the first place, which is exactly why transcoding to them helps so much, covered in more detail two sections down.
Does the free version of DaVinci Resolve limit GPU decoding?
Yes, and this trips up more people than any single driver setting.
On Windows and Linux, GPU-accelerated decoding of H.264 and H.265 requires DaVinci Resolve Studio. The free version decodes those two codecs entirely on the CPU on those two platforms, no matter what graphics card is installed, because the acceleration is gated behind the paid license rather than the hardware. This mirrors the same Studio-only split that applies to GPU-accelerated encoding on export, and it's the single most common reason someone on the free version reports a maxed-out CPU next to an idle GPU on footage that should decode easily.
macOS breaks that pattern entirely. The free version of DaVinci Resolve on Apple silicon does use the Mac's hardware media engine for H.264 and H.265, both decode and encode, because that acceleration lives at the operating system level through Apple's own frameworks rather than inside Resolve's licensing. A free-version editor on an M-series Mac and a free-version editor on a Windows PC can run the exact same footage through the exact same version of Resolve and get completely different CPU behavior, purely because of the platform.
| Platform | Free version H.264/H.265 GPU decode | Studio H.264/H.265 GPU decode |
|---|---|---|
| Windows | No, software decode only | Yes, on supported GPU generations and formats |
| Linux | No, software decode only | Yes, on supported GPU generations and formats |
| macOS (Apple silicon) | Yes, via the OS-level media engine | Yes, same hardware path |
If you're on Windows or Linux and consistently seeing this pattern on H.264 or H.265 footage, check your Resolve edition from the splash screen or Help menu before anything else. If it says free, or Lite, the CPU-heavy behavior you're seeing on those two codecs isn't a bug to chase. It's the license working as designed, and the two real options are upgrading to Studio or transcoding your footage to a codec that decodes cheaply regardless of edition.
How do you turn on hardware decoding in Decode Options?
A handful of clicks, and it's worth doing even if you're not sure it's the whole fix, since it costs nothing to have it on.
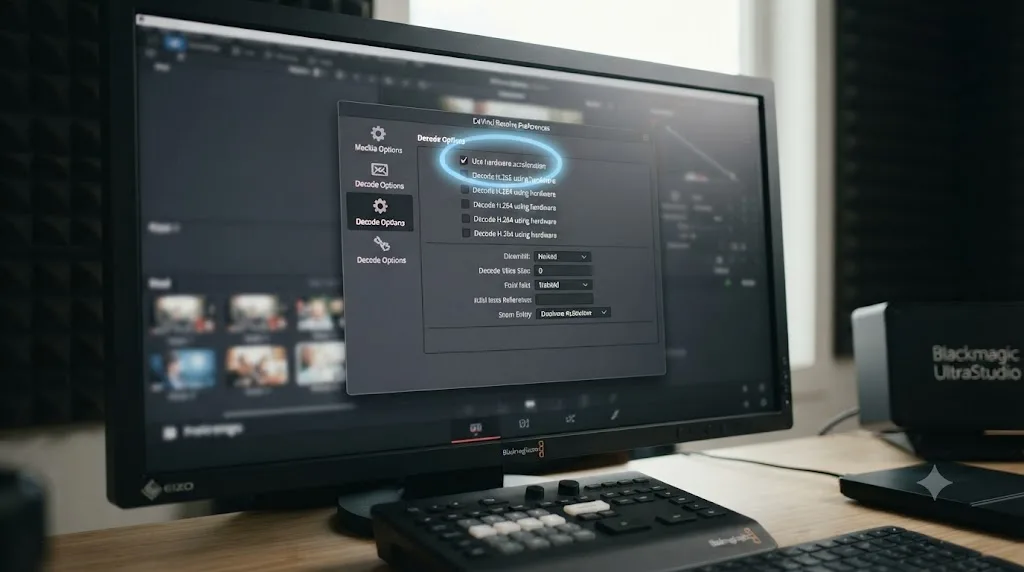
- Open Preferences from the DaVinci Resolve menu (or File menu on Windows).
- Go to the Decode Options tab, listed under System on most recent versions.
- Check "Decode H.264/H.265 using hardware acceleration."
- If a GPU vendor option appears, pick the one matching your installed card.
- Save preferences and fully quit and restart Resolve.
DaVinci Resolve's own manual describes the setting plainly: "Decode H.264/HEVC using hardware acceleration: Allows the use of hardware acceleration for H.264 or HEVC playback, if available on the computer you're using," per DaVinci Resolve's manual documentation of Decode Options. Notice the qualifier: "if available." Checking the box doesn't force hardware decoding to happen. It only allows Resolve to use it when your GPU, edition, and footage format all line up to support it. That's the gap that trips people up next.
That restart step matters more than it looks. Decode-related preference changes in Resolve frequently don't take effect on a project that's already open, and testing "did the fix work" on a session that hasn't restarted will give you a false negative every time.
Which GPUs and codecs actually get hardware decode in Resolve Studio?
This is the part that turns "I checked the box and nothing changed" into an actual answer, and it's more granular than most people expect.
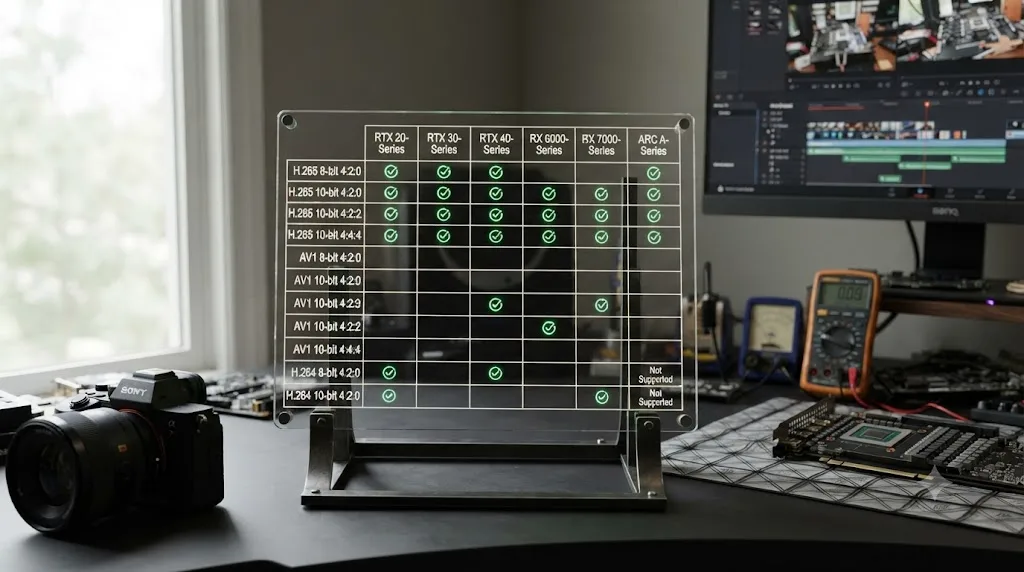
DaVinci Resolve deciding to decode a clip in software isn't a single on-off switch, it's a lookup against your exact GPU generation, codec, bit depth, and chroma subsampling all at once. Puget Systems maintains a continuously updated matrix of exactly this, testing specific H.264 and H.265 bit-depth and chroma-subsampling combinations against specific GPU generations inside Resolve Studio itself, because the answer genuinely changes between AMD, NVIDIA, and Intel hardware, and between Resolve versions. The firm's own framing of the problem: "not all types of H.264 and H.265 media are supported," and coverage depends on both "the capability of the hardware in your system" and which Resolve version you're running, per Puget Systems' breakdown of H.264 and H.265 hardware decode support in DaVinci Resolve Studio. Their tables have shifted from version to version, with Resolve Studio 20 specifically expanding coverage on newer GPU generations that had none in earlier releases.
Practically, that means the honest answer to "does my GPU hardware-decode this file" is "check the current matrix for your exact card, your exact Resolve version, and your exact footage's bit depth and chroma subsampling," not a blanket yes or no by brand. A 2026-era GPU and an aging one from the same manufacturer can behave completely differently on the identical clip.
On the decoder-silicon side, the reason any of this is possible at all is that modern GPUs ship a dedicated hardware decode block separate from their general compute cores. NVIDIA's own documentation for its NVDEC decoder is explicit about the split: "with complete decoding offloaded to NVDEC, the graphics engine and CPU are free for other operations," per NVIDIA's NVDEC Application Note. That's the entire promise of hardware decoding in one sentence, a separate, purpose-built circuit doing the decompression so neither your CPU nor your GPU's general cores have to. Whether that circuit engages for your specific file is the part that depends on the codec support matrix.
| What you know | What it tells you |
|---|---|
| Codec is H.264 or H.265, common bit depth and chroma (8-bit 4:2:0) | Best odds of hardware decode on a recent GPU with Studio |
| Codec is H.264 or H.265, but 10-bit 4:2:2 or higher chroma | Support depends heavily on your specific GPU generation, check the current matrix |
| Codec is a RAW format (BRAW, R3D) | Hardware decode support is separate from this table entirely, tied to debayer settings |
| Codec is ProRes or DNxHR | Hardware decode isn't the relevant question; these decode cheaply on CPU already |
If you've confirmed hardware decoding is checked, your edition is Studio, and your GPU driver is current, and CPU usage is still maxed out on H.264 or H.265 footage, the next most likely culprit is exactly this: your footage's specific bit depth or chroma subsampling combination simply isn't one your GPU generation hardware-decodes in the current Resolve version. That's not a bug you can fix with a preference. It's a hardware and software support gap, and the fix moves to the next section.
Does transcoding to ProRes or DNxHR fix high CPU usage?
Yes, and it's the most reliable fix in this entire article, because it sidesteps the whole hardware-decode-support question instead of trying to win it.
Once your footage is transcoded, or you've generated Optimized Media, which does the same job automatically, Resolve is no longer decompressing a long-GOP H.264 or H.265 stream on every single frame request. It's reading an intermediate codec that was built from the ground up to decode cheaply, on the CPU, without needing GPU acceleration to feel responsive. That's Richard Lackey's point from earlier restated as a fix: the decoding work happens once, during the transcode, instead of over and over during every scrub, every playhead jump, every real-time playback session.
Two ways to get there inside Resolve:
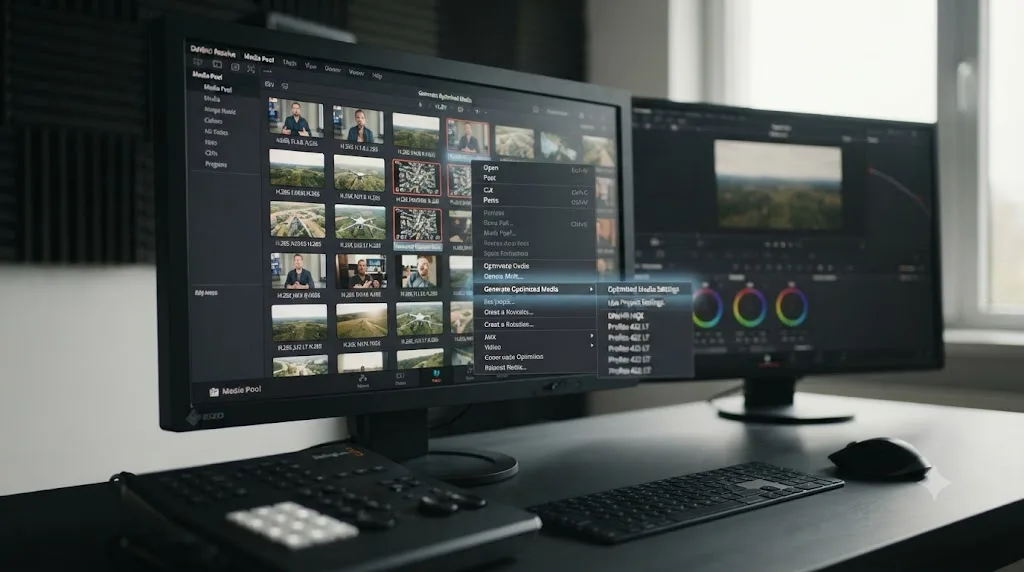
Optimized Media. Right-click your clips in the Media Pool, choose Generate Optimized Media, and Resolve transcodes them in the background to a codec set in Project Settings > Master Settings > Optimized Media, defaulting to DNxHR on Windows and ProRes on Mac. Turn on Playback > Use Optimized Media if Available and Resolve automatically swaps in the lighter file for editing while keeping your original media as the source of truth for final renders.
Proxy Media. Similar mechanism, generated at a lower resolution as well as a friendlier codec, useful when your bottleneck is partly decode cost and partly raw pixel volume on a 4K or 6K timeline. Playback > Timeline Proxy Mode set to Half or Quarter Resolution stacks on top of proxies for an even lighter working file.
Both approaches trade disk space and a one-time transcode wait for a CPU that stops fighting your timeline in real time. On a laptop or an older desktop where the GPU decode support gap is the actual cause, this is usually a bigger, more reliable win than chasing driver updates or preference toggles that were never going to engage for your specific footage anyway.
Transcoding to ProRes or DNxHR moves the expensive part of the job, decompression, out of the export pipeline entirely, so your CPU stops fighting your timeline in real time. If you haven't already, our slow playback guide walks through the same Optimized Media and proxy workflow in more depth, including the specific Resolve 21.0.2 update that fixed an NVIDIA decode bug producing this exact stutter pattern.
Are Fusion titles and OpenFX plugins pegging your CPU instead of your GPU?
Sometimes, and this cause has nothing to do with decoding at all, which is why chasing Decode Options for it wastes an evening.
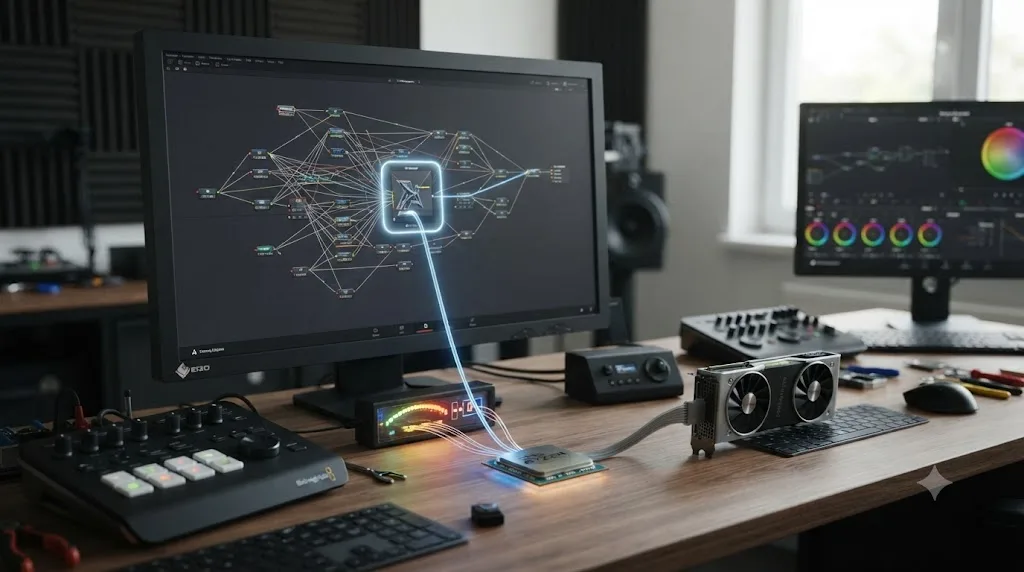
Fusion, the compositing page inside Resolve, is a genuinely different engine from the color and edit pages, and it leans harder on the CPU by design. Puget Systems' own guidance for Resolve workstations is specific about it: "for Fusion, you are better off with a CPU that has a high frequency than one with a lot of cores," a very different recommendation than the firm gives for the rest of the app, per Puget Systems' hardware recommendations for DaVinci Resolve. If your high CPU, low GPU pattern shows up specifically when you scrub past a clip carrying a Fusion title, a 3D text composition, or a particle system, that's Fusion behaving normally, not a decode failure.
OpenFX plugins that were never coded with CUDA or OpenCL support run on the CPU inside DaVinci Resolve, no matter how powerful your graphics card is. Third-party OFX effects, some noise reduction tools, certain stabilizers and stylize plugins, have to be explicitly built by their developer to hand work to a GPU. If a plugin only ships a CPU code path, Resolve runs it on the CPU, full stop, and your graphics card can sit there doing almost nothing while a single effect on a single clip drags your whole timeline's playback down.
The tell here is specificity. A codec-driven decode problem shows up broadly, across most or all of your footage, because it's tied to the source files, not any one effect. A Fusion or OFX-driven CPU spike shows up narrowly, tied to one clip, one node, one plugin, and it disappears the moment you bypass or delete that specific element. Test it: park on the suspect clip, toggle the Fusion composition or OFX node off, and watch whether CPU usage drops immediately. If it does, you've found a CPU-bound effect, not a decode problem, and the fix is optimizing or replacing that specific tool, not touching Decode Options at all. Our Fusion render slow guide covers the Fusion side of this in more depth, including which node types are the worst offenders.
Is Resolve using the wrong GPU entirely?
On a laptop or a desktop with two graphics processors, more often than you'd guess.
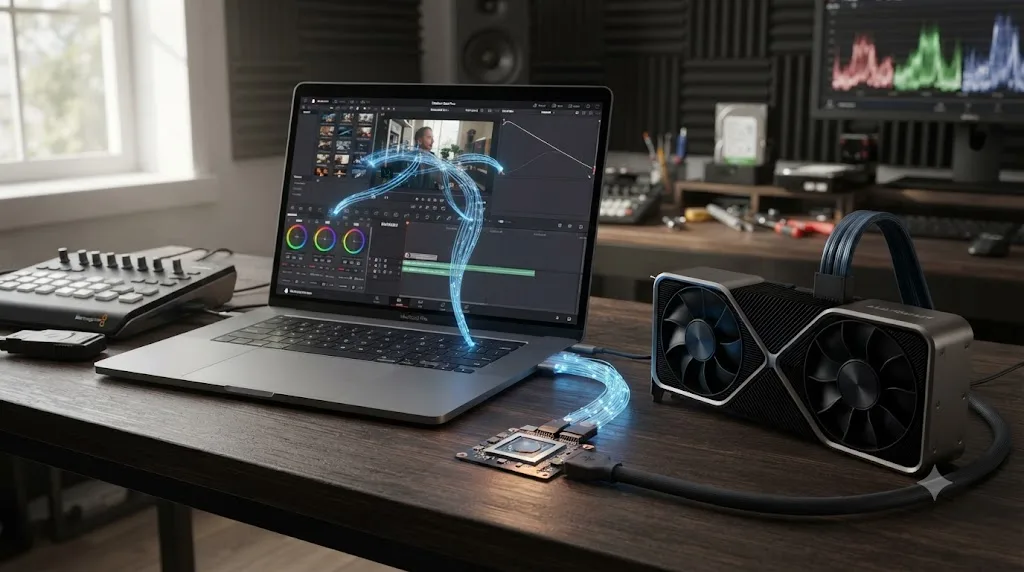
Systems with both integrated graphics and a dedicated GPU sometimes have Resolve pointed at the weaker chip, either because GPU Selection inside Resolve's own preferences has the wrong card checked, or because the operating system is routing the app to integrated graphics regardless of what Resolve requests. Either way, the symptom looks identical to a decode-support gap: the CPU compensates for the weak or absent GPU acceleration, and the dedicated card you actually paid for sits mostly idle.
Check inside Resolve first. Open Preferences > System > Memory and GPU. Under GPU Selection, confirm Auto has your dedicated card selected, or manually tick it and untick integrated graphics if Auto is guessing wrong. This is the same panel worth checking whenever Resolve's GPU-related behavior doesn't match your hardware, documented in DaVinci Resolve's manual coverage of the Memory and GPU preferences.
Then check outside Resolve, on Windows specifically. Windows Settings > System > Display > Graphics lets you assign a specific GPU to any application. Add Resolve to the list, set it to High performance, and confirm that assignment matches what you just set inside Resolve's own GPU Selection. When the two disagree, one of them wins in a way that's hard to predict, and the safest fix is making sure both agree explicitly rather than trusting either one's "Auto" setting.
This is a different failure mode than an AMD card simply not being detected at all, which is a driver and OpenCL problem covered start to finish in our AMD GPU not detected guide. Here, the GPU is detected and working. It's just not the one doing the work, which is why Task Manager or Activity Monitor can show your dedicated card at a low percentage while a completely different GPU entry, if you look for it, is quietly busier.
Does it matter whether this happens during playback, editing, or export?
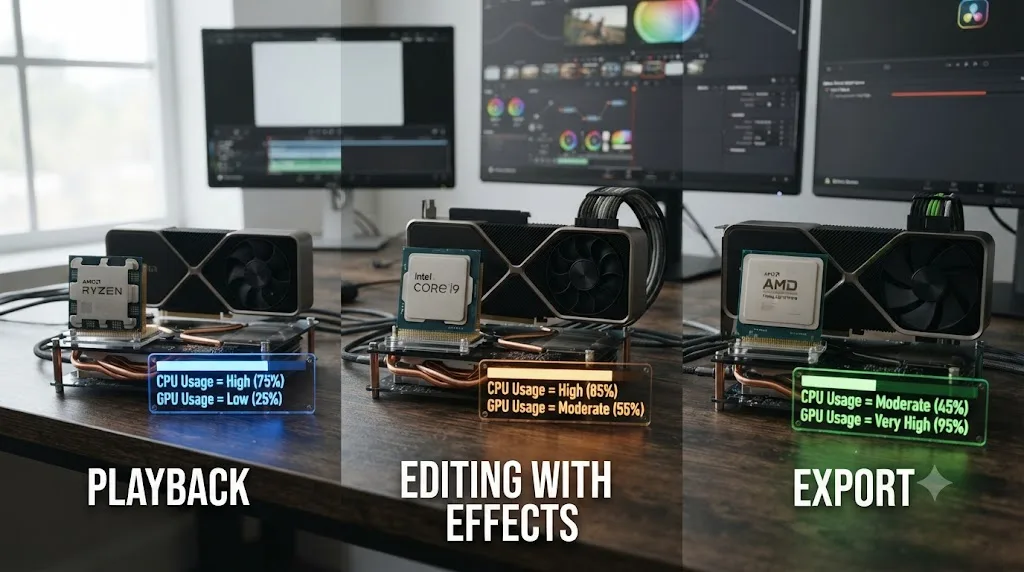
Yes, because each phase stresses decode and render differently, and matching the symptom to the phase narrows the cause fast.
| When it happens | What's most likely | Where to look first |
|---|---|---|
| Scrubbing or playing back plain footage, no effects | Software decode of the source codec | Decode Options, footage codec/bit depth, GPU Selection |
| Only on clips with a Fusion title, 3D element, or specific plugin | A CPU-only Fusion node or OFX plugin | Isolate the clip, toggle the effect, check the plugin's GPU support |
| During export, but playback was fine | Export uses different settings than the timeline; check Encoder on Deliver page | Deliver page Encoder dropdown, separate from Decode Options |
| Only on RAW footage (BRAW, R3D) | Debayer quality setting, not standard decode | Project Settings > Camera RAW > Decode Quality |
| Only right after a driver or Resolve update | A regression in decode behavior for your specific GPU | Roll back the driver, or check Resolve's release notes for known decode fixes |
| Consistently across every clip, every codec | Wrong GPU selected, or GPU decode genuinely unsupported on your card | GPU Selection preference, Windows graphics routing |
The export row deserves its own note, since it's the most commonly confused row on this table. Playback decoding and export encoding are controlled by different settings entirely. Decode Options governs how Resolve reads your source footage into the app. The Encoder dropdown on the Deliver page governs how Resolve writes your finished render back out. A system that plays back smoothly with the GPU barely touched can still show high CPU and low GPU during export if Encoder is set to Native, a completely separate issue covered in full in our GPU utilization 0% during export guide. Fixing one doesn't automatically fix the other, because they're not the same pipeline.
Is some CPU-heavy, GPU-idle behavior actually normal?
Yes, and knowing which cases are expected saves you from chasing a fix for something that was never broken.
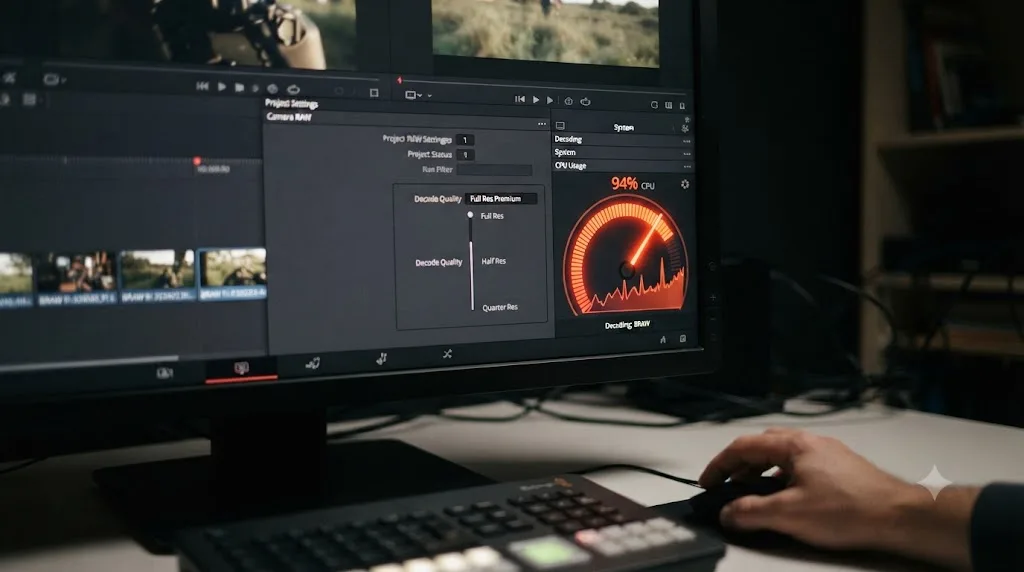
RAW debayer is the clearest example. Project Settings > Camera RAW > Decode Quality controls how much processing goes into converting a BRAW or R3D file's raw sensor data into a usable image, and higher decode quality settings ask for more work, some of which runs on the CPU depending on the codec and your platform. A CPU-heavy debayer pass on a high-quality RAW setting isn't a bug. It's the tradeoff you asked for by choosing quality over speed.
AI-driven tools inside Resolve are a second example, and a genuinely counterintuitive one. You'd assume anything branded AI runs entirely on the GPU, but that's not how it plays out in practice. Puget Systems' GPU scaling analysis, authored by Matt Bach, found the opposite in several categories: "many AI tasks in Resolve... actually utilize the CPU to a considerable degree," which is exactly why adding a second or third high-end GPU produced almost no speed improvement on those specific workflows, per Puget Systems' DaVinci Resolve Studio v20 GPU scaling analysis. The same analysis documented a case where even a top-tier processor became the limiting factor for a high-end GPU on RAW codec work, with Bach noting plainly, "we believe that we are simply hitting the point where the CPU is holding back the cards." If a benchmark firm that builds workstations for a living sees a CPU bottleneck a GPU that costs more than most complete editing rigs, a modest CPU bottleneck on your system during a similar task isn't a mystery to solve. It's the same physics at a different scale.
The distinction that actually matters is whether the CPU-heavy behavior is broad or narrow. Broad, affecting all your footage regardless of what's on the timeline, points back to decode. Narrow, tied specifically to a RAW decode quality setting, an AI-powered tool, or a particular effect, is often the expected cost of that specific feature, and no preference change will make it disappear without giving something else up, quality, speed, or the feature itself.
What does a real diagnosis look like, start to finish?
Take a common report and walk it end to end. A Windows laptop, RTX 4060 mobile GPU, DaVinci Resolve free version, editing 4K 60fps H.265 footage straight from a phone. CPU sits at 95 to 100% during playback. GPU usage in Task Manager barely clears 10%.
Start with the edition. The Help menu confirms it's the free version, running on Windows. That's the single biggest clue on the whole list: H.264/H.265 GPU decoding is a Studio-only feature on Windows, so this system was never going to hardware-decode this footage, no matter what the GPU is capable of on paper.
Two real choices exist from here, not one. Upgrading to Studio unlocks GPU decode for supported formats, assuming this specific footage's bit depth and chroma subsampling fall inside the current support matrix for an RTX 4060 mobile chip, which isn't guaranteed. Transcoding sidesteps that uncertainty entirely: generating Optimized Media in DNxHR shifts the decode cost off both the CPU-in-real-time problem and the GPU-support-matrix question at once, since the intermediate codec never needed hardware acceleration to feel responsive in the first place.
In this example, Optimized Media wins on reliability. It works regardless of edition, regardless of whether this exact H.265 flavor makes it onto a support matrix that changes between Resolve versions. The tradeoff is disk space and a one-time transcode wait, both cheaper than a Studio upgrade if the immediate goal is just getting the timeline to scrub smoothly.
Now change one variable. Same laptop, same footage, but this time it's Resolve Studio and the Decode Options checkbox is already ticked. GPU usage still barely moves. Here the next stop is GPU Selection, since laptop hybrid graphics is the most common reason a Studio license with hardware decode enabled still shows no GPU activity: Resolve, or Windows, is routing the work to the laptop's integrated chip instead of the RTX 4060 sitting right next to it. Checking Preferences > System > Memory and GPU alongside Windows' own per-app graphics assignment resolves this variant in most cases without touching a single codec setting.
Two different systems, an almost identical symptom, two completely different root causes, and two completely different fixes. That's the entire reason this troubleshooting has to go in order instead of guessing at the first plausible-sounding cause.
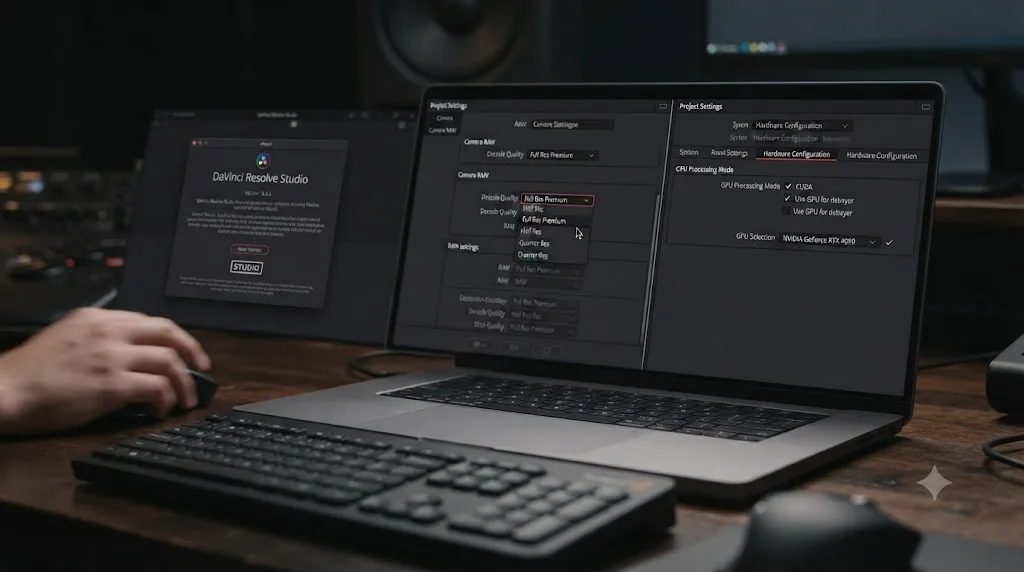
Is this different on a Mac with Apple silicon?
Yes, in a way that can make a perfectly healthy Mac look broken if you're reading the wrong number.
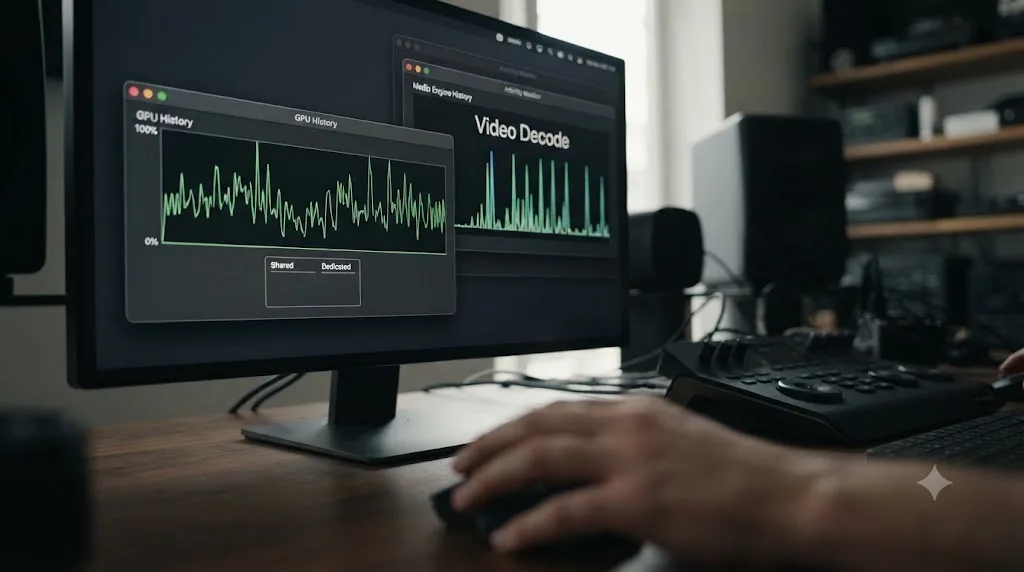
Apple silicon doesn't decode H.264 and H.265 on the same cores Activity Monitor's GPU graph is generally reflecting. It uses a dedicated media engine, separate silicon built specifically for video encode and decode, the same conceptual split as NVDEC versus general compute cores on an NVIDIA card. Activity Monitor's GPU History window, opened through Window > GPU History, shows one general activity graph per GPU with no per-engine breakdown, per Apple's own support documentation for Activity Monitor. There's no way to isolate "media engine" from "GPU cores" the way Windows' Task Manager lets you isolate Video Decode as its own graph.
On Apple silicon, DaVinci Resolve's hardware decoding lives in a dedicated media engine that Activity Monitor doesn't break out separately from the GPU. That means a modest-looking GPU number during 4K H.265 playback on an M-series Mac doesn't automatically mean hardware decode failed. It often means the media engine, not the general GPU cores, is doing the work, quietly, off to the side of the graph you're watching.
Real elevated CPU usage on Apple silicon points somewhere else: heavy Fusion work, CPU-only OFX plugins, high RAW debayer settings, or genuinely unsupported footage, wide dynamic range camera logs with unusual chroma subsampling, for instance. Unified memory changes the resource math too, since CPU and GPU share one memory pool rather than competing for separate ones, which is a different topic covered in full in our Apple silicon M4 settings guide, including how much unified memory different workflows actually need.
Do laptops make this worse?
Almost always, and for reasons that stack on top of everything above rather than replacing it.
A laptop's dedicated GPU sitting idle while the fans scream is usually hybrid graphics quietly routing DaVinci Resolve to the integrated chip instead. Windows laptops built with both integrated and dedicated graphics default new applications to the integrated chip to preserve battery life, and Resolve is not exempt from that default just because it's a demanding application. If GPU Selection inside Resolve and the operating system's own graphics assignment disagree about which chip Resolve should use, the CPU frequently ends up compensating for whichever GPU actually got skipped.
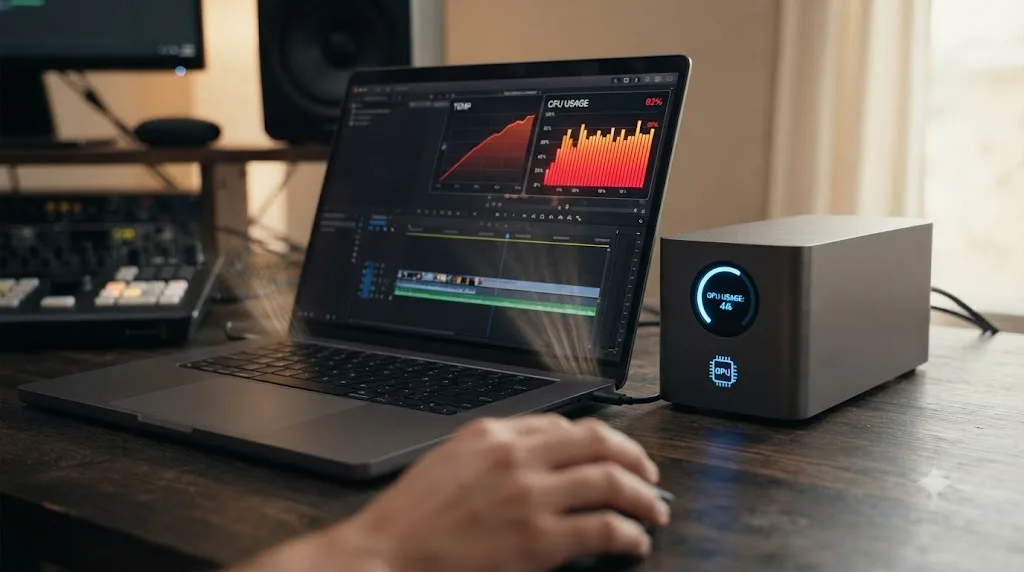
Thermal throttling adds a second layer specific to laptops. A laptop CPU sustaining 100% for an extended editing session can hit its thermal ceiling and clock down, which paradoxically can make a decode-bound workload feel even more CPU-bound, since the same amount of work now takes longer on a slower-clocked processor. If your laptop's fans ramp to maximum and playback gets choppier the longer you work rather than staying consistent, that's a thermal signature worth investigating separately from the decode-support questions above, since no Decode Options checkbox fixes a processor that's downclocking to stay cool.
The practical laptop checklist, in order: confirm GPU Selection inside Resolve matches the dedicated card, confirm Windows Graphics settings assigns Resolve to High performance, plug in rather than run on battery during heavy sessions since many laptops throttle performance modes automatically when unplugged status changes, and keep an eye on whether CPU-heavy behavior gets worse over a long session, which points at thermals rather than decode. Our proxy media setup guide for slow laptops covers the working-file side of this in more depth, useful regardless of which specific cause turns out to be yours.
What's the full troubleshooting order for high CPU, low GPU?
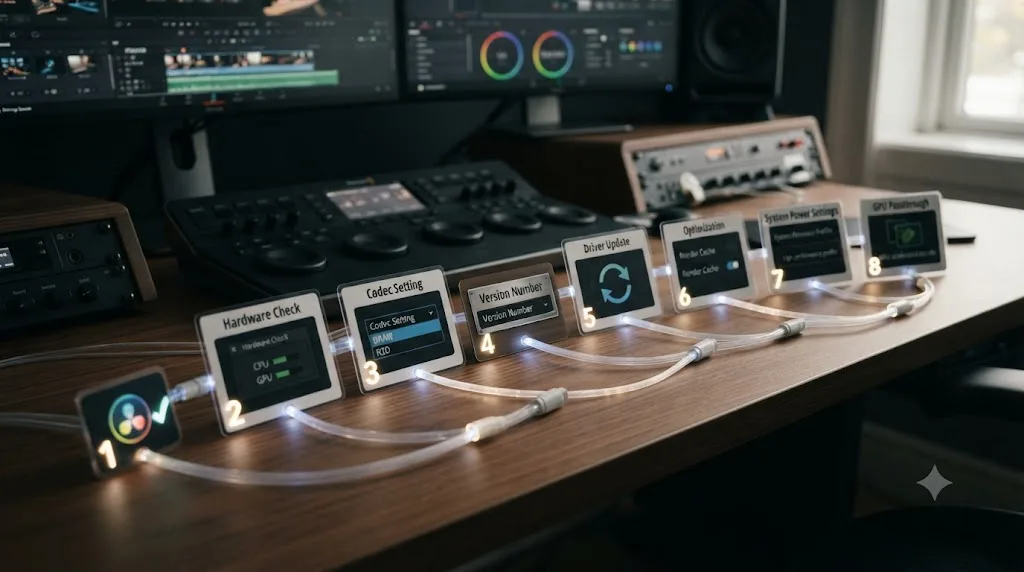
Work through it in this order, and stop the moment the CPU number comes back down to something reasonable for what you're actually doing:
- Confirm your edition and platform. Free version on Windows or Linux with H.264/H.265 footage was never going to hardware-decode, by design. Check the splash screen or Help menu first.
- Turn on Decode Options. Preferences > Decode Options > Decode H.264/H.265 using hardware acceleration, pick your GPU vendor, then fully restart Resolve.
- Check whether your specific footage format is supported. Bit depth and chroma subsampling matter as much as the codec name. Not every H.265 file is created equal on a hardware decode matrix.
- Transcode or generate Optimized Media for footage that isn't hardware-decodable on your setup. This is the fix that works regardless of GPU generation or support matrix, at the cost of a one-time transcode.
- Isolate whether the cause is decode-related at all. If the CPU spike is tied to one clip, one Fusion node, or one plugin rather than your footage broadly, this is a CPU-bound effect, not a decode problem, and Decode Options was never going to fix it.
- Check GPU Selection, in Preferences > System > Memory and GPU and, on laptops, in Windows Graphics settings. A detected but unused GPU produces the exact same symptom as an unsupported codec.
- Update your GPU driver directly from NVIDIA, AMD, or Intel. Resolve 21.0.2 specifically shipped a fix for an NVIDIA H.264/H.265 decode bug that produced this exact pattern, so a driver or Resolve version that predates that fix is worth ruling out on its own.
- On a laptop, watch for thermal throttling over a long session, and plug in rather than run on battery during heavy editing.
If you've worked through all eight and the CPU is still doing all the work on footage and effects that should genuinely favor the GPU, that's the point to treat it as a genuine hardware or driver fault rather than a configuration gap, the same escalation point covered for GPU detection problems in our AMD GPU not detected guide, whose driver and OpenCL troubleshooting applies just as well here once the simpler causes are ruled out.
Working through Decode Options, GPU Selection, and a codec support matrix that changes between Resolve versions is exactly the kind of "which setting is actually the problem" confusion that slows editors down far more than the fix itself takes once you know it. TryUncle is the on-screen assistant for DaVinci Resolve on macOS - ask in plain words and Uncle points at the exact control on your screen. It watches your actual Preferences window and tells you whether Decode Options or GPU Selection is set the way you think it is, instead of you cross-referencing a screenshot against a menu that's moved since the last Resolve update. It's a paid app in founder pricing, not a free tool, and macOS only, so it won't fix a Windows driver for you, but if this same "is this setting actually doing what I think it's doing" confusion is slowing you down anywhere else in Resolve, on the Edit, Color, or Fusion page, TryUncle is built for exactly that gap. Check tryuncle.com for the current rate before assuming it fits your setup.
Here's the short version to keep in your head next time the fans spin up. High CPU with low GPU is Resolve telling you decoding landed on the wrong processor, not that your graphics card is broken. Check your edition, check Decode Options, check whether your exact footage format is actually supported, and transcode when it isn't. Most of the time, your GPU was never idle by choice. It just never got asked to do the job in the first place.
Frequently asked questions
- What does high CPU usage but low GPU usage mean in DaVinci Resolve?
- It means the decoding work, turning your compressed source file into pixels Resolve can process, is happening on your processor instead of your graphics card. The GPU still handles color and effects, but decoding is a separate job, and when it lands on the CPU it can max out a processor while the GPU sits nearly idle.
- Why is DaVinci Resolve not using my GPU at all?
- Usually one of four reasons: your footage is a codec or bit depth Resolve can't hardware-decode on your GPU, you're on the free version where H.264/H.265 GPU decoding is a Studio-only feature on Windows and Linux, hardware decoding is switched off in Preferences, or Resolve has the wrong GPU selected entirely, often integrated graphics on a laptop.
- Does the free version of DaVinci Resolve support GPU decoding?
- Not for H.264 or H.265 on Windows or Linux. GPU-accelerated decoding of those two codecs is a DaVinci Resolve Studio feature on those platforms. On macOS the free version does get hardware decoding, because Apple's operating system handles that acceleration outside Resolve's own licensing.
- How do I turn on hardware decoding in DaVinci Resolve?
- Open Preferences, go to the Decode Options tab (System > Decode Options on some versions), and check Decode H.264/H.265 using hardware acceleration, then pick your GPU vendor if a choice appears. Restart Resolve completely, since this setting doesn't apply to an already-open project.
- Does transcoding to ProRes or DNxHR actually fix high CPU usage?
- Yes, for the playback and scrubbing case. Once footage is transcoded to an editing-friendly intermediate codec, the expensive real-time decompression is already done, so Resolve reads simpler frames instead of decoding long-GOP H.264 or H.265 on every single playhead move.
- Is high CPU with low GPU ever normal in DaVinci Resolve?
- Yes. Fusion compositions, many OpenFX plugins, and some RAW debayer settings genuinely lean on the CPU by design, and Puget Systems has documented cases where even a high-end GPU sits underused because the CPU can't feed it fast enough. The question isn't whether the CPU is working, it's whether the specific task in front of you should be GPU-bound and isn't.
- Why does this happen on some clips and not others in the same timeline?
- Because hardware decode support is per-codec and per-format, not a single on/off switch for your whole project. A clip shot in a supported flavor of H.265 can decode on the GPU while the next clip, same camera, different bit depth or chroma setting, falls back to the CPU without any warning from Resolve.
- Is this different on a Mac with Apple silicon?
- Yes. Apple silicon decodes H.264 and H.265 on a dedicated media engine that's separate from both the CPU cores and the general GPU cores Activity Monitor graphs. High CPU with a modest-looking GPU number on an M-series Mac usually just means Activity Monitor isn't showing you the engine that's actually doing the work.
Sources
- Puget Systems: What H.264 and H.265 Hardware Decoding is Supported in DaVinci Resolve Studio?
- Puget Systems: DaVinci Resolve Studio v20 GPU Scaling Analysis (Matt Bach)
- Puget Systems: Hardware Recommendations for DaVinci Resolve
- Puget Systems: Is Your Footage Hardware Accelerated in DaVinci Resolve? (Peter Emery)
- Richard Lackey: AVC / H.264 / HEVC and DaVinci Resolve, Why You Need to Transcode
- DaVinci Resolve 18 Manual: Decode Options (VFXPedia mirror)
- DaVinci Resolve 18 Manual: Memory and GPU preferences (VFXPedia mirror)
- NVIDIA Video Codec SDK: NVDEC Application Note
- Apple Support: View GPU activity in Activity Monitor on Mac
Put this guide to work with TryUncle.
Ask about the step you’re on. TryUncle sees your screen and points at the control you need, so you can keep learning in your own project.
Get TryUncle for Mac or WindowsKeep reading
Fixes · Jul 7, 2026 · 25 min
DaVinci Resolve Playback Choppy or Stuttering? The Real Fix
Fix choppy DaVinci Resolve playback with Optimized Media, Proxy Media, Render Cache, Timeline Proxy Mode, and the Resolve 21.0.2 NVIDIA decode fix.
Fixes · Jul 7, 2026 · 25 min
DaVinci Resolve GPU Memory Is Full: Every Real Fix
Why DaVinci Resolve throws 'GPU memory is full,' and which fixes actually work: timeline resolution, drivers, effects, and how much VRAM you need.
Fixes · Jul 17, 2026 · 23 min
DaVinci Resolve AMD GPU Not Detected: Every Real Fix
DaVinci Resolve not seeing your AMD GPU? Here's why it happens on Windows, Mac, and Linux, and the exact driver, preference, and Windows fixes that work.